

Operational efficiency drives profit because it lowers the cost of every unit you make or serve, raises how much you can produce with the same resources, cuts the rework that eats margin, and frees up cash that’s currently tied up in inventory and receivables. This isn’t theory. In a global survey cited by IBM, many CEOs said they’d pursue operational efficiencies specifically to drive total revenue growth, not just to trim expenses. Energy efficiency alone shows the pattern clearly: ENERGY STAR calculations tied to IBM’s research show a 10% cut in energy consumption tends to lift net operating income by roughly 1.5% in commercial real estate.
That kind of leverage is why efficiency belongs on the same agenda as sales growth, not filed under “cost control.”
Three levers pay off fastest for mid-market leaders:
- Process mapping to find where work stalls or repeats
- Inventory optimization to free cash trapped in stock
- Quality controls to cut the cost of redoing work
Get those three right and the profit impact shows up in a single quarter, before you touch a bigger transformation program.
Key Takeaways
Operational efficiency raises profit by cutting unit costs, increasing throughput without proportional overhead, reducing defects, and freeing cash tied up in working capital.
| Point | Details |
|---|---|
| Efficiency is a growth lever | 77% of CEOs pursue operational efficiencies specifically to drive revenue growth, not just cut costs, per IBM. |
| Five mechanisms drive profit | Cost reduction, higher throughput, quality gains, working capital reduction, and pricing power each hit a different P&L line. |
| Energy savings hit the bottom line fast | A 10% cut in energy use lifts net operating income roughly 1.5%, per ENERGY STAR data. |
| Holistic programs outperform single-lever fixes | Integrating process, labor, energy, quality, and supply chain together beats isolated initiatives, with quality management showing the strongest effect. |
| A structured system sustains the gains | Dynamicgrowthsolutions’s AOS pairs assessment and documented playbooks so efficiency improvements outlast the initial pilot and support exit readiness. |
Table of Contents
- What Counts as Operational Efficiency for Mid-Market Firms
- How Efficiency Gains Convert Into Profit Dollars
- Common Levers Mid-Market Companies Use to Improve Efficiency
- How to Measure Operational Efficiency and Turn It Into ROI
- A Practical Rollout Plan for Mid-Market Leaders
- What the Research Says About Holistic Efficiency Programs
- Where Efficiency Programs Go Wrong
- Why Prioritization Beats Perfection
- How the Accelerated Operating System Turns Efficiency Into Exit Value
- Frequently Asked Questions
- Sources
What Counts as Operational Efficiency for Mid-Market Firms
Operational efficiency means getting more useful output from the same input, without sacrificing quality. It’s the ratio between what you spend to run the business and what that spending returns in usable product, service, or revenue. NetSuite’s guide frames it this way and ties it directly to measurable KPIs rather than vague notions of “running lean.”
For a mid-market company, the scope is broader than most owners assume. It covers:
- Process design and workflow sequencing
- Labor productivity and scheduling
- Asset and equipment utilization
- Energy and utility consumption
- Supply chain and inventory management
- Quality control and defect prevention
- The technology stack that ties all of it together
Notice what’s missing from that list: layoffs. Efficiency work that starts and ends with headcount reduction usually damages the very output quality it was supposed to protect.
Pro Tip: When you present efficiency initiatives to your board or a potential buyer, frame them as margin protection and growth enablement, not cost cutting. Investors read “we cut $400,000 in costs” as defensive. They read “we freed $400,000 in capacity to reinvest in growth” as offensive. Same number, very different signal.
That framing matters more than it sounds. NetSuite’s own analysis notes that efficiency initiatives support reinvestment capacity and sustainable growth, not just a better income statement for one quarter.
How Efficiency Gains Convert Into Profit Dollars
Five mechanisms turn an operational improvement into a bigger number at the bottom of your P&L. Understanding which one you’re pulling matters, because each shows up on a different line.
-
Direct cost reduction. Lowering the cost per unit, whether that’s a manufactured part, a billable hour, or a processed claim, drops straight to gross margin. If you cut $2 off the cost of producing 50,000 units annually, that’s $100,000 in additional profit with zero change in price or volume.
-
Higher throughput. Getting more output from the same fixed costs (rent, equipment, salaried staff) means each additional unit carries almost no incremental cost. A plant running at 70% capacity that pushes to 85% doesn’t need 15% more overhead. Nearly all of that extra revenue converts to profit.
-
Quality and defect reduction. Rework, returns, and warranty claims are pure margin destruction. A services firm that cuts rework hours from 12% to 6% of total labor effectively gives itself a 6% productivity gain without hiring anyone.
-
Working capital reduction. Faster inventory turns and shorter receivables cycles free cash that would otherwise sit idle or require a credit line to bridge. That cash reduces interest expense or funds growth without dilution.
-
Pricing and premium potential. Consistent quality and reliable delivery let you defend price, or charge a premium, in ways a chaotic operation can’t. Buyers pay more for certainty.
The Springer research on technical efficiency and profitability backs this up at the firm level: efficiency is strongly associated with both current and future profitability, and inefficient firms consistently show lower returns and higher operating risk. Inefficiency doesn’t just cost you today. It compounds against you.
Here’s the formula executives actually need for a business case:
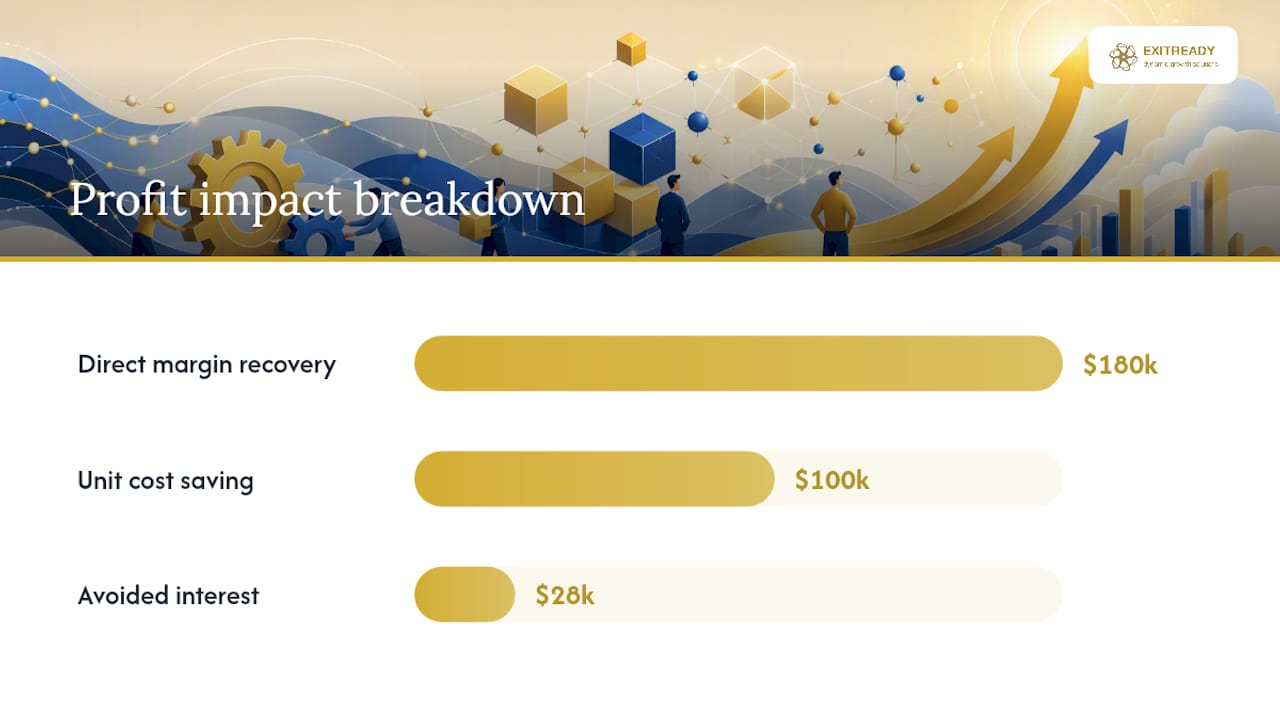
Profit Impact = (Unit Cost Reduction × Units Sold) + (Margin Recovered From Fewer Defects) + (Interest or Opportunity Cost Saved From Reduced Working Capital)
Run a quick example. That’s $180,000 in direct margin recovery plus about $28,000 in avoided interest, before counting a single dollar from throughput gains. Most owners never run this math, which is exactly why efficiency work gets undersold to the board.
The ENERGY STAR to NOI relationship follows the same logic on the facilities side: a 10% energy consumption cut lifts net operating income by about 1.5%, a figure worth quoting anytime someone dismisses utility spend as immaterial.
Common Levers Mid-Market Companies Use to Improve Efficiency
Most efficiency gains come from a short list of proven levers, not exotic technology. The trick is matching the lever to your business model.
- Process mapping and SOPs, documenting how work actually happens versus how you think it happens. Almost every mid-market company finds gaps here first. The role of documented procedures in reducing owner dependency is one of the fastest wins available.
- Frontline automation for repetitive, rules-based tasks like invoice matching, scheduling, or order entry.
- Predictive maintenance, using equipment data to prevent breakdowns instead of reacting to them. Manufacturing and distribution businesses see the clearest payoff here.
- Inventory optimization, right-sizing stock levels against actual demand instead of gut feel or “what we’ve always ordered.”
- Workforce training and scheduling, matching skilled labor to peak demand periods rather than staffing flat across the week.
- Energy management, auditing utility contracts and consumption patterns, which partner guidance on reducing facility costs shows can be done without cutting service quality.
- Vendor and contract renegotiation, revisiting supplier terms annually instead of letting contracts auto-renew.
Manufacturers usually get the fastest return from predictive maintenance and inventory optimization. Service firms see more from scheduling and SOPs. Distribution businesses tend to find their biggest lever sitting in inventory turns and vendor terms simultaneously.
A regional manufacturer that adds sensor-based monitoring to catch equipment wear early, a use case detailed in BeyondSensor’s operational efficiency guide, can cut unplanned downtime enough to add several production days back per year, worth real revenue on equipment that was previously idle during repairs.

How to Measure Operational Efficiency and Turn It Into ROI
You can’t manage what you don’t measure, and vague efficiency talk is how good initiatives die in budget meetings. FranklinCovey’s research makes the point directly: sustainable efficiency requires measurable performance standards, not just good intentions from leadership.
Start with these KPIs:
- Overall Equipment Effectiveness (OEE): Availability × Performance × Quality. This tells you what percentage of planned production time is actually productive.
- Cycle time: total time from the start of a process to its completion, whether that’s a manufacturing run or a client onboarding sequence.
- Throughput: units or transactions completed per hour or per shift.
- Cost per unit: total operating cost divided by units produced or served.
- Inventory turns: cost of goods sold divided by average inventory value.
- Working capital days: how long cash is tied up between paying suppliers and collecting from customers.
| KPI | Why it matters | How to calculate it | P&L line affected |
|---|---|---|---|
| OEE | Shows real production capacity being wasted | Availability × Performance × Quality | Cost of goods sold |
| Cycle time | Reveals bottlenecks slowing revenue recognition | Total elapsed time per process | Revenue timing, overhead |
| Cost per unit | Direct measure of margin per sale | Total operating cost ÷ units produced | Gross margin |
| Inventory turns | Shows how efficiently cash converts to sales | COGS ÷ average inventory | Working capital, interest expense |
| Working capital days | Flags cash trapped in operations | Days inventory + days receivable, minus days payable | Cash flow, financing cost |
To size the dollar impact, apply the same logic each time: take the percentage change in a KPI, multiply it against the cost or revenue base it touches, and you have a defensible ROI number for the board. Tracking these consistently, using a framework like the performance metrics owners should track, turns quarterly guesswork into a repeatable reporting habit.
A Practical Rollout Plan for Mid-Market Leaders
Efficiency programs fail more often from poor sequencing than from bad ideas. Follow a structure instead of tackling everything at once.
- Run a quick diagnostic. Map your current cost per unit, cycle time, and inventory turns before touching anything. You need a baseline or you can’t prove improvement.
- Identify your top three value levers. Rank them by dollar impact, not by what feels most urgent day to day.
- Design a pilot. Test the highest-impact lever in one location, product line, or department before rolling out company-wide.
- Set scale criteria in advance. Decide what result triggers expansion before you start, so success isn’t a moving target.
- Build governance around the change. Assign clear ownership (a RACI chart works fine) and a simple scorecard reviewed monthly.
Use an impact-versus-effort matrix to pick where to start: plot each candidate initiative on those two axes and prioritize whatever lands in high impact, low effort. That’s almost always where inventory and process-mapping work sits for a first pilot.
- Stage rollouts in phases instead of flipping the switch company-wide
- Keep small buffer inventories during transitions so customer service doesn’t suffer while you test
- Review the scorecard monthly, not quarterly, during the first two pilots
Pro Tip: The biggest threat to a good efficiency program isn’t the plan. It’s the third month, when the initial energy fades and nobody’s checking the scorecard anymore. Build the review cadence into someone’s job description before you launch, not after momentum stalls.
What the Research Says About Holistic Efficiency Programs
A 2026 mixed-methods study in the Journal of Production, Operations Management and Economics found that integrating process, labor, energy, quality, and supply chain efficiency together produces stronger financial returns than tackling any single dimension in isolation. Quality management showed the largest positive effect on firm-level economic performance.
That finding, from JPOME’s unified framework research, should reshape how mid-market leaders sequence their efficiency work. Chasing one lever, like automation alone, without also addressing quality and supply chain, leaves most of the value on the table.
- Quality management delivered the single largest financial return of any dimension studied
- Isolated cost-cutting projects consistently underperformed integrated programs
- Analysts and investors often underweight operational inefficiency risk, according to Springer’s productivity analysis, which can produce unpleasant surprises for firms that look fine on the surface but run inefficiently underneath
Use this research when you build an internal business case. A single-lever pilot is a fine starting point, but the payoff compounds when you connect it to at least one adjacent function.
Where Efficiency Programs Go Wrong
Most failed efficiency initiatives share the same handful of mistakes.
- Cost cuts that damage quality. Slashing spend without redesigning the process usually pushes the cost downstream into returns and complaints.
- No baseline measurement. You can’t prove ROI, or catch a slide, if you never captured the “before” numbers.
- Ignoring working capital effects. A lever that speeds production but bloats inventory can be a net loss even when the headline metric improves.
- Weak change management. Employees quietly reverting to old workflows within weeks is the single most common reason gains don’t stick.
- Buying technology before fixing process. Automating a broken workflow just makes the broken workflow faster.
Before approving any initiative, check it against three questions: Do we have a baseline? Does this affect working capital, positively or negatively? Who owns making sure the change survives past month three?
Why Prioritization Beats Perfection
Every mid-market transformation engagement follows a familiar pattern: leadership finds a dozen legitimate opportunities and tries to fix all of them simultaneously. The ones that actually move profit are the three or four that get finished, measured, and defended past the first rough quarter. Owners consistently underestimate how much value sits in unglamorous levers like inventory turns and defect tracking, and overestimate what a new software platform alone will fix.
The lesson that holds up across engagements: sustaining a gain is harder than finding it. A scorecard nobody checks after ninety days quietly erases the improvement it was built to protect.
How the Accelerated Operating System Turns Efficiency Into Exit Value
Most efficiency advice stops at the pilot. The gap between finding a lever and sustaining it for years, the part that actually protects your valuation, is where most mid-market owners get stuck without a system behind them. Dynamicgrowthsolutions built the Accelerated Operating System (AOS) specifically to close that gap: a documented framework that replaces one-off projects with governance your team can run without you standing over it.

Working through AOS typically follows a clear sequence: a baseline assessment of where your operations leak profit, a prioritized roadmap ranked by dollar impact, a pilot on the highest-value lever, a scaling plan once results hold, and ongoing measurement built into your reporting cadence. Because the system is designed around documented playbooks, the gains outlast whoever implemented them, which matters enormously if you’re building toward a sale.
If you want to see where your own operation stands before committing to anything, start with what a business operating system actually does for owners and request an assessment from there.
Frequently Asked Questions
Why does operational efficiency drive profit more reliably than cutting prices or increasing marketing spend?
Price cuts and marketing spend both carry real costs and uncertain returns. Efficiency gains lower your cost base permanently, so the margin improvement compounds on every future unit sold, not just the next campaign cycle.
What’s the fastest KPI to move if I want to see profit impact this quarter?
Inventory turns and cycle time usually show measurable movement within 60 to 90 days, since they don’t require new hiring or capital equipment, just better process discipline.
Does operational efficiency work apply to service businesses, or just manufacturing?
It applies to both. Service firms typically find their biggest gains in scheduling, rework reduction, and standardized procedures rather than equipment utilization.
How do I know if an efficiency initiative is worth pursuing before I invest time in it?
Run it through an impact versus effort assessment and require a baseline measurement first. If you can’t quantify the current state, you can’t prove the initiative worked.
Can a small efficiency gain really affect my company’s valuation at exit?
Yes. Buyers pay premiums for businesses with documented, repeatable operations because those operations don’t depend on the owner to function, which directly reduces the risk a buyer is taking on.
Sources
These sources anchor the measurement frameworks, financial math, and research findings used throughout this piece:
- Assessing technical efficiency: effects on future profits and returns | Journal of Productivity Analysis | Springer
- What Is Operational Efficiency? A Definition and Guide | NetSuite
- What is Operational Efficiency? Definition & Strategies | FranklinCovey