

Gross margin subtracts cost of goods sold from revenue and speaks to lenders, investors, and anyone outside the company; contribution margin subtracts variable costs and speaks to the managers making pricing and product calls. Both metrics matter, but for different reasons: one belongs in financial reporting, the other belongs in the decision room.
TL;DR:
- Contribution margin excludes fixed costs, making it useful for short-term pricing, product decisions, and break-even analysis, unlike gross margin.
- Fixed costs can inflate gross margin differences, so comparing contribution margins across companies is unreliable unless costs are well classified.
- Contribution margin ratios shift with sales mix and volume, affecting break-even calculations, especially for multi-product firms.
- Relying solely on gross margin can hide unprofitable pricing decisions, while ignoring fixed costs can overstate product profitability.
- Accurate contribution margin analysis requires validated cost classification, supported by diagnostic tools and structured analysis to prevent misleading decisions.
Table of Contents
- Definitions: managerial math versus financial accounting
- Formulas and a worked example side by side
- Choosing the right margin for pricing, reporting, and boards
- Turning contribution margin into a break-even number
- Where cost classification goes wrong
- Presenting margins so stakeholders don’t mix them up
- What gross margin means depends on the industry
- Volume swings hit each margin differently
- Real scenarios where the two margins tell different stories
- The risk of leaning on just one number
- How each margin shapes a pricing decision
- Contribution margin as a product-line decision tool
- A consultant’s note on making the numbers useful
- Getting margin analysis right with structured support
- Sources
- FAQ
Definitions: managerial math versus financial accounting
Gross margin is revenue minus cost of goods sold (COGS). COGS typically bundles direct materials, direct labor, and a share of manufacturing overhead, including some fixed costs like factory rent or equipment depreciation. Because it follows accounting standards built for external reporting, gross margin shows up on the income statement lenders and investors read.
Contribution margin is revenue minus variable costs only, meaning costs that rise and fall with each unit sold: direct materials, sales commissions, shipping, and variable labor. It ignores fixed costs entirely, which lets managers see how much of every sales dollar is left to cover fixed costs and generate profit once those are paid.
The two views can be organized differently without changing the bottom line:
- A traditional income statement separates COGS from operating expenses and reports gross margin as a subtotal.
- A contribution-format income statement separates all costs into variable and fixed buckets instead, which is built for internal decisions.
- Both formats land on the same operating income; they just group the same expenses differently for different audiences.
Formulas and a worked example side by side
The formulas are simple once the cost categories are sorted correctly.
- Gross profit = revenue minus COGS.
- Gross margin percentage = gross profit divided by revenue, multiplied by 100.
- Contribution margin (dollars) = revenue minus total variable costs.
- Contribution margin ratio = contribution margin divided by revenue, multiplied by 100.
Say a company sells 1,000 units at $50 each, for $50,000 in revenue. Direct materials and variable labor run $20 per unit ($20,000 total), and the company allocates $8 per unit of fixed manufacturing overhead into COGS ($8,000 total), so COGS totals $28,000. Separately, the company pays $5,000 in fixed overhead that is not allocated into COGS and $3,000 in variable selling costs like commissions.
Contribution margin only subtracts the variable pieces: $20,000 in variable production cost plus $3,000 in variable selling cost, for $23,000 in variable costs.
| Metric | Revenue | Costs subtracted | Result | Margin % |
|---|---|---|---|---|
| Gross margin | $50,000 | $28,000 COGS (includes $8,000 fixed overhead) | $22,000 | 44% |
| Contribution margin | $50,000 | $23,000 variable costs only | $27,000 | 54% |
Contribution margin comes out higher here because it excludes the $8,000 of fixed overhead that gross margin’s COGS bucket absorbs, a gap that widens or narrows depending on how much fixed cost a company buries in its cost of goods sold.
Choosing the right margin for pricing, reporting, and boards
Each metric answers a different question, so the job at hand should dictate which one you pull.
- Reach for contribution margin when testing a price change, evaluating a one-off order, running break-even math, ranking SKUs, or designing sales commissions.
- Reach for gross margin when reporting to a bank, comparing profitability against industry benchmarks, or talking to investors who expect standard financial statements.
- When sharing numbers internally, use both and label your assumptions so nobody mistakes one for the other.
Pro Tip: Label every contribution-margin figure with a note on what counts as variable in that calculation, since the same labor line can be fixed in one report and variable in another.
Investopedia frames it plainly: gross margin serves overall profitability and external comparisons, while contribution margin drives break-even analysis and other short-term calls. Neither replaces the other; they sit side by side in a well-run finance function.
Turning contribution margin into a break-even number
Contribution margin’s real payoff shows up in cost-volume-profit (CVP) analysis, where it converts straight into a break-even point.
- Breakeven units = total fixed costs divided by contribution margin per unit.
- Breakeven sales dollars = total fixed costs divided by the contribution margin ratio.
- Multiply the breakeven unit count by price to check that it matches the breakeven dollar figure.
Using the earlier example, contribution margin per unit is $27 ($27,000 divided by 1,000 units). Multi-product companies need a caveat here: the blended contribution margin ratio shifts with sales mix, so a breakeven estimate built on last quarter’s mix can mislead this quarter’s forecast. Higher contribution margins also mean higher operating leverage, so profit swings faster in both directions as volume moves.
Where cost classification goes wrong
Most contribution margin errors start with mislabeling a cost, not with bad arithmetic. A subcontractor paid per project looks variable, but the same subcontractor on a retainer behaves like a fixed cost. Direct labor is variable in a factory that adjusts shifts to demand, but fixed in a business locked into salaried staff regardless of volume. Time horizon changes the answer too: a cost that is fixed this quarter can become variable once a contract renews.
- Watch for costs reclassified only to make a margin look better; that inflates the number without changing the underlying economics.
- Confirm whether a cost scales with units, with time, or with neither before assigning it.
- For product-line or customer decisions, calculate a second-level contribution margin that also subtracts attributable fixed costs, since a line can show a positive first-level margin and still lose money once its dedicated costs are counted.
Presenting margins so stakeholders don’t mix them up
Confusion usually comes from showing a number without saying what it excludes. Note explicitly when variable costs exclude fixed manufacturing overhead, and state whether a chart is showing gross margin or contribution margin before the first bar appears.
- Show both metrics together when a board or lender conversation covers both profitability and a specific pricing decision.
- Use a one-line disclosure such as “variable costs exclude fixed manufacturing overhead and allocated overhead” on any internal contribution-margin report.
- For charts, percentage bars work better than raw dollars for cross-period comparisons, paired with a short footnote on what counts as variable.
What gross margin means depends on the industry
Comparing a manufacturer’s gross margin against a software company’s tells you almost nothing; the number only means something next to peers with a similar cost structure.
Within a single industry, gross margin trends over time say more than a single snapshot. A gross margin sliding quarter over quarter usually points to rising input costs, discounting pressure, or a shift toward lower-margin products, and any of the three demands a different response. A margin holding steady while revenue grows suggests the business is scaling without losing pricing discipline.
This is also why lenders and investors lean on gross margin for benchmarking rather than contribution margin: gross margin follows consistent accounting rules across companies, so comparisons hold up. Contribution margin depends on each company’s internal judgment about what counts as variable, which makes it accurate for a single business’s decisions but shaky for cross-company comparison. A retailer’s contribution margin and a consultancy’s are not built the same way, even if the percentages happen to match.
Volume swings hit each margin differently
Gross margin percentage tends to stay fairly stable as volume changes, since both revenue and COGS usually move together in a straightforward production or resale business. Contribution margin percentage stays even more stable by design, since it is calculated specifically from variable costs that track volume.
The real story shows up in dollar terms rather than percentages. As volume rises, total contribution margin dollars climb directly with sales, and once fixed costs are covered, nearly every additional contribution dollar becomes profit. That is the operating leverage effect: a company with high fixed costs and a strong contribution margin ratio sees profit accelerate faster than revenue once it clears breakeven, and it sees losses deepen just as fast if volume drops below that point.
Gross margin dollars also grow with volume, but the relationship softens once fixed manufacturing overhead is spread across more units. Producing more units without adding factory capacity lowers the fixed overhead cost per unit embedded in COGS, which nudges gross margin percentage upward even without a price change. That effect disappears once a company needs a new shift, a new machine, or more warehouse space to keep growing, at which point fixed costs step up and gross margin can compress again until volume catches up.
Real scenarios where the two margins tell different stories
Both numbers are accurate; they just answer different questions about the same business.
A contract manufacturer taking a one-off rush order illustrates the gap more sharply. The order’s price might sit below the company’s normal fully loaded cost, making it look unprofitable on a gross margin basis. But if variable costs are covered and fixed costs are already paid for by existing volume, the order still contributes positive dollars toward profit, which is exactly the kind of call contribution margin is built to make and gross margin is not.
A multi-location retailer comparing stores might find two locations with identical gross margins but very different contribution margins, because one carries higher variable labor from overtime-heavy staffing. Gross margin alone would suggest the stores perform the same; contribution margin exposes the operational difference driving actual profit.
The risk of leaning on just one number
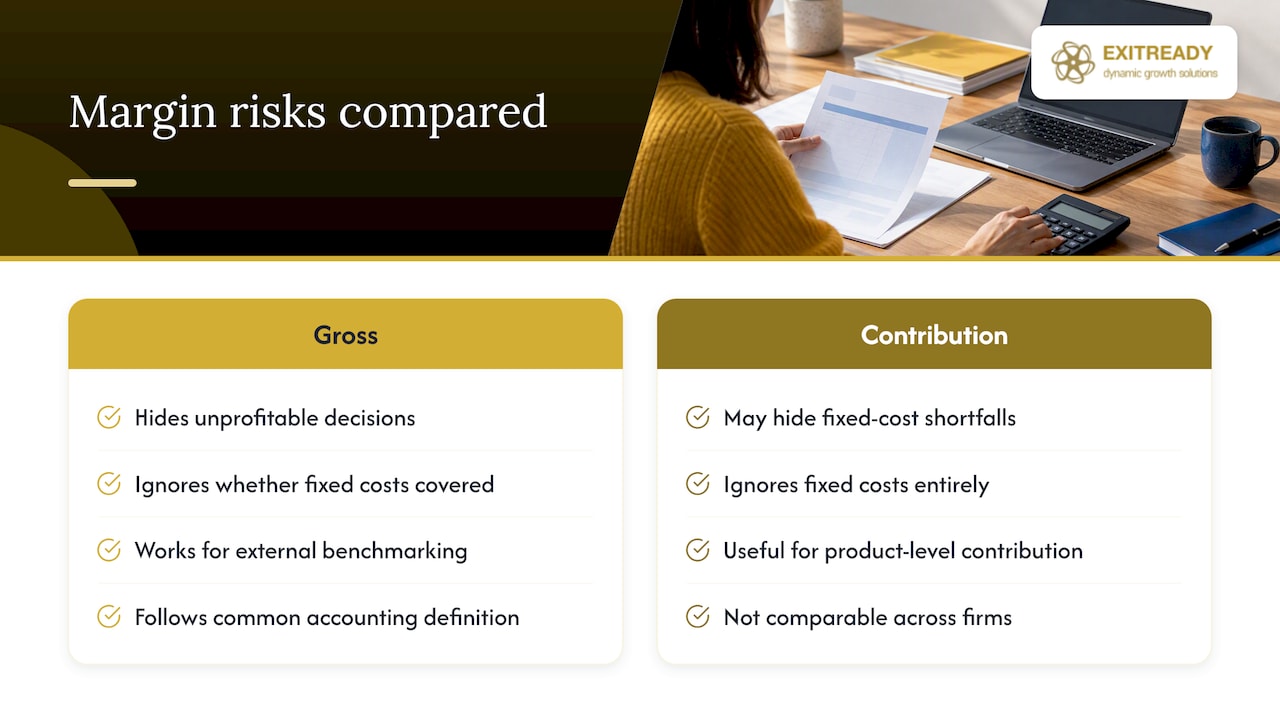
Relying on gross margin alone can hide unprofitable pricing decisions, since it says nothing about which products or orders still make sense once fixed costs are covered. Relying on contribution margin alone carries the opposite risk: it can make a struggling product look fine because fixed costs never enter the calculation, right up until those fixed costs come due.
The other common mistake is comparing contribution margins across companies as if they were built the same way. Gross margin at least follows a common accounting definition, which is why it works for external benchmarking and contribution margin does not.
A related trap is treating either margin as a complete picture of profitability. Neither accounts for fixed costs that are not attributable to a specific product line, and neither replaces a full look at operating income and cash flow. HBR’s guidance is direct on this point: contribution margin is useful for evaluating how a specific product contributes to profit, but recategorizing costs as fixed or variable is rarely as clean as it looks on paper, and getting it wrong undermines every decision built on top of it.
How each margin shapes a pricing decision
Gross margin sets the outer boundary for pricing: a price that cannot clear COGS and target gross margin over time will erode the business, no matter how attractive a single order looks. It is the number used for long-run pricing policy and product launch targets.
Contribution margin is the number used for pricing at the margin, meaning decisions about one order, one customer, or one temporary promotion, as explained in this Developer Hiring & Engineering Service Pricing model where variable costs influence margin outcomes. A discount that still clears variable costs adds contribution dollars even if it falls below the standard gross margin target, which is why contribution margin, not gross margin, is the right lens for a limited-time offer or a deal to fill idle capacity. Confusing the two leads to two opposite mistakes: rejecting a profitable short-term order because it fails a long-run gross margin test, or accepting too many discounted orders because they clear variable costs while quietly failing to cover fixed costs across the business.
Contribution margin as a product-line decision tool
When a company sells multiple products or serves multiple customer segments, contribution margin becomes the tool for deciding what to keep, grow, or drop. Ranking products by contribution margin per unit, or by contribution margin per unit of a constrained resource like machine hours, shows which lines generate the most profit potential for the capacity they consume.

This is short-term thinking by design. A product with a low contribution margin ratio but high volume can still generate more total contribution dollars than a high-margin, low-volume product, so the ranking has to use dollars, not just percentages. Before cutting a line based on this analysis, run the second-level contribution margin that subtracts its own attributable fixed costs, since dropping a product can also remove revenue that was covering shared overhead, leaving the remaining lines worse off.
A consultant’s note on making the numbers useful
Contribution margin only holds up when the cost classification behind it is right, and that is the step most teams rush. A structured diagnostic, the kind our ProfitDriver Analysis work is built around, forces that classification into the open before it drives a pricing or product decision.
— Andre
Getting margin analysis right with structured support
Working out formulas is the easy part; validating which costs actually behave as fixed or variable inside your specific business takes more scrutiny than a spreadsheet usually gets. That is the gap our diagnostic work is built to close, starting with a clear read on where your margins stand before any pricing or product decision gets made.

Our ProfitDriver Analysis™ examines cost behavior across your product lines and customers to produce a decision-ready view of contribution margin, not just a reported gross margin. For teams that want a faster, more concentrated version of that work, the ProfitDriver 3 Day Diagnostic Workshop compresses the process into a short engagement, and the Growth Sprint applies the same diagnostic thinking to broader operational gaps.
- A validated cost-behavior model you can trust for pricing and product decisions.
- A break-even and CVP scenario built on your actual numbers, not textbook assumptions.
- A short, structured path from margin analysis to specific pricing or product actions.
If your team is unsure whether last quarter’s margins reflect real cost behavior or a spreadsheet shortcut, schedule a strategy call and we will walk through what a diagnostic would look like for your numbers.
Sources
- ACCTG340 contribution margin vs gross margin (Penn State World Campus)
- Contribution margin: What it is, how to calculate it, and why you need it (HBR)
- Cost-Volume-Profit Analysis (Tennessee State University materials)
- Gross margin vs contribution margin (Investopedia)
FAQ
Is a 30% contribution margin good?
Compare it against your own break-even requirement rather than a general benchmark.
What does a 30% gross margin mean?
Whether that is healthy depends heavily on the industry, since typical gross margins vary significantly between retail segments and software or services.
What is an example of contribution margin?
That $27 goes first toward covering fixed costs, with anything left over counting as profit.
What is another name for contribution margin?
Contribution margin is sometimes called marginal profit or the contribution to profit, since it reflects the amount a sale contributes after variable costs are covered. It is distinct from gross profit, which is calculated after cost of goods sold rather than variable costs alone.
One Response