

Customer profitability analysis measures the true profit each account generates after loading the full cost to serve it, and in most portfolios it exposes a hard truth: a chunk of your customer base is quietly subsidized by the rest. Run the math and you get a ranked list of accounts to protect, reprice, or exit. Skip it, and you keep pricing and staffing decisions on revenue alone, which is exactly how profitable-looking customers end up losing you money.
TL;DR:
- Customer profitability analysis reveals that many high-revenue accounts are often unprofitable once full costs are loaded, especially custom packaging and rush deliveries.
- Proper calculations depend on accurate inputs like pocket revenue, direct costs, and activity-based cost-to-serve rates, which must be consistently applied across accounts.
- Focusing on the top 20 or 50 accounts initially helps identify major profit surprises and prevents overbuilding complex models for small, less impactful customers.
- Accounts should be ranked by contribution margin II and segmented into protect, maintain, or exit categories, with decisions tracked via pilots and clear ownership.
- Regular updates of the model are essential, as shifts in driver volumes, freight rates, or costs can cause margin distortions within a few quarters.
Table of Contents
- What Customer Profitability Analysis Actually Measures
- How to Calculate Customer Profitability: Formulas and a Worked Example
- Building a Cost-to-Serve Model That Doesn’t Collapse Under Its Own Weight
- Turning Rankings Into Action: Protect, Maintain, Reprice, or Exit
- Running CPA Without Drowning Your Finance Team
- Where Customer Profitability Analysis Breaks Down
- How Dynamic Growth Solutions Applies CPA Inside AOS
- Setting Realistic Profitability Targets by Segment
- What Customer Profitability Analysis Looks Like in Practice
- Keeping the Model Current Instead of Letting It Go Stale
- When Customer Profitability Analysis Is Worth Running Now
- How Dynamic Growth Solutions Turns CPA Into Margin
- Sources
- FAQ
What Customer Profitability Analysis Actually Measures
Customer profitability analysis, often shortened to CPA, starts with a simple idea: revenue on the invoice is not the same as money you actually keep. Get from one to the other and you need a shared vocabulary.
Start with pocket revenue, the cash left after discounts, rebates, freight you absorbed, and the cost of carrying a slow-paying account. That number, not the invoice total, is your real starting point. Subtract direct costs, mainly cost of goods sold, and you get gross margin. Subtract the customer’s share of selling and account-management expense and you land on Contribution Margin I (CM I), the profit before anyone counts what it costs to actually service the account day to day.
CM I is where most companies stop, and it’s also where they get fooled. The real number is CM II: CM I minus cost-to-serve, meaning every order line, delivery, return, and support call tied to that customer. CM II is the account’s true operating margin.
Plot every customer by cumulative profit against cumulative revenue rank and you get what practitioners call the whale curve. It typically shows:
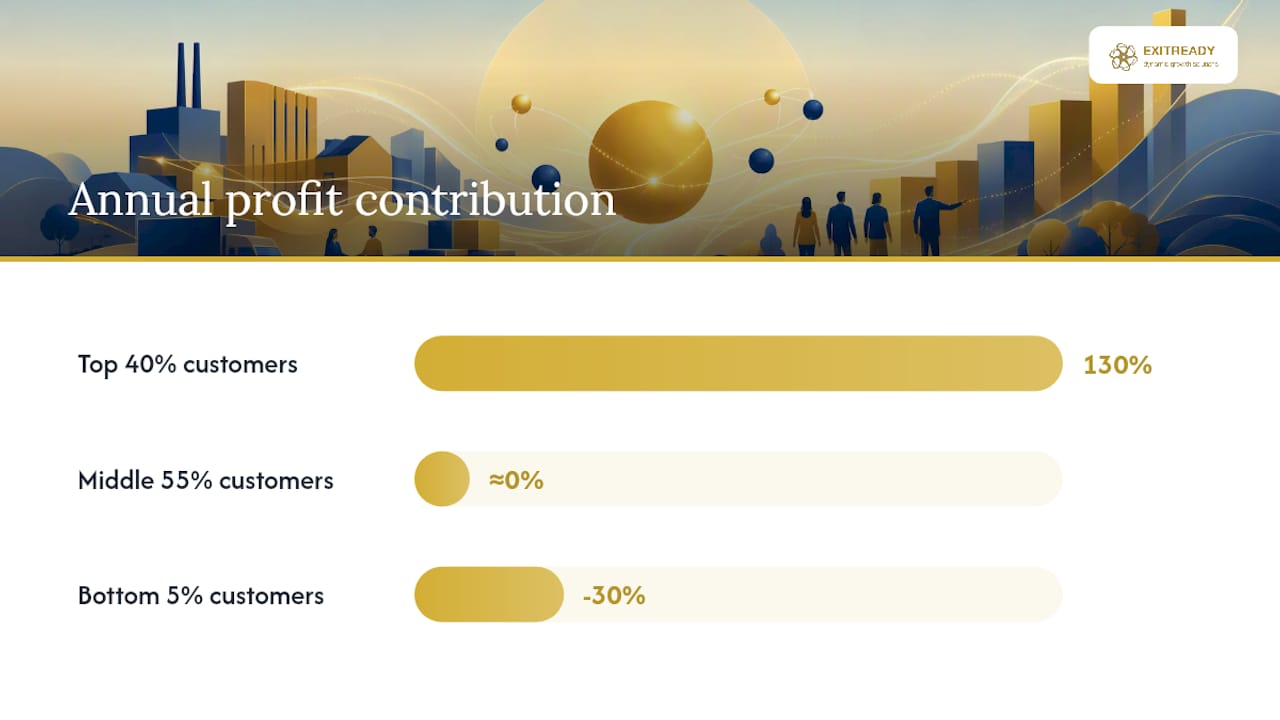
- A “peak” of maybe the top 40% of accounts generating well over 100% of total profit
- A flat middle that roughly breaks even
- A “tail” of loss-making accounts that drag the total back down
Harvard’s Balanced Scorecard research on customer profitability found that in many companies, the most profitable 40% of customers generate about 130% of annual profits, the middle 55% roughly break even, and the bottom 5% erase 30% of profit. That shape, not the revenue ranking, is what should drive your account strategy.
How to Calculate Customer Profitability: Formulas and a Worked Example
The math behind customer profitability analysis is not complicated. The discipline is in getting every input right and applying it consistently across accounts.
- Pocket revenue = Invoice amount − discounts/rebates − absorbed freight − payment-cost carry (the implicit cost of late-paying customers)
- CM I = Pocket revenue − direct product/service cost − allocated sales expense
- Cost-to-serve = Σ (activity rate × driver volume for that customer), built from a rate card covering orders, order lines, deliveries, returns, and service visits
- CM II (customer operating profit) = CM I − cost-to-serve
- Operating margin % = CM II ÷ pocket revenue
Driver-based allocation is the piece most spreadsheets get wrong. Each activity rate is calculated as: rate = annual expense pool ÷ annual driver volume. If your order-processing team costs $260,000 a year and processes 52,000 orders, the rate is $5.00 per order. Multiply that by how many orders a given customer placed, and repeat for every driver, to build their total cost-to-serve.
Pro Tip: Run the math on your five biggest accounts by revenue before building the full model. It takes an afternoon, and it usually surfaces at least one uncomfortable surprise that justifies doing the rest.
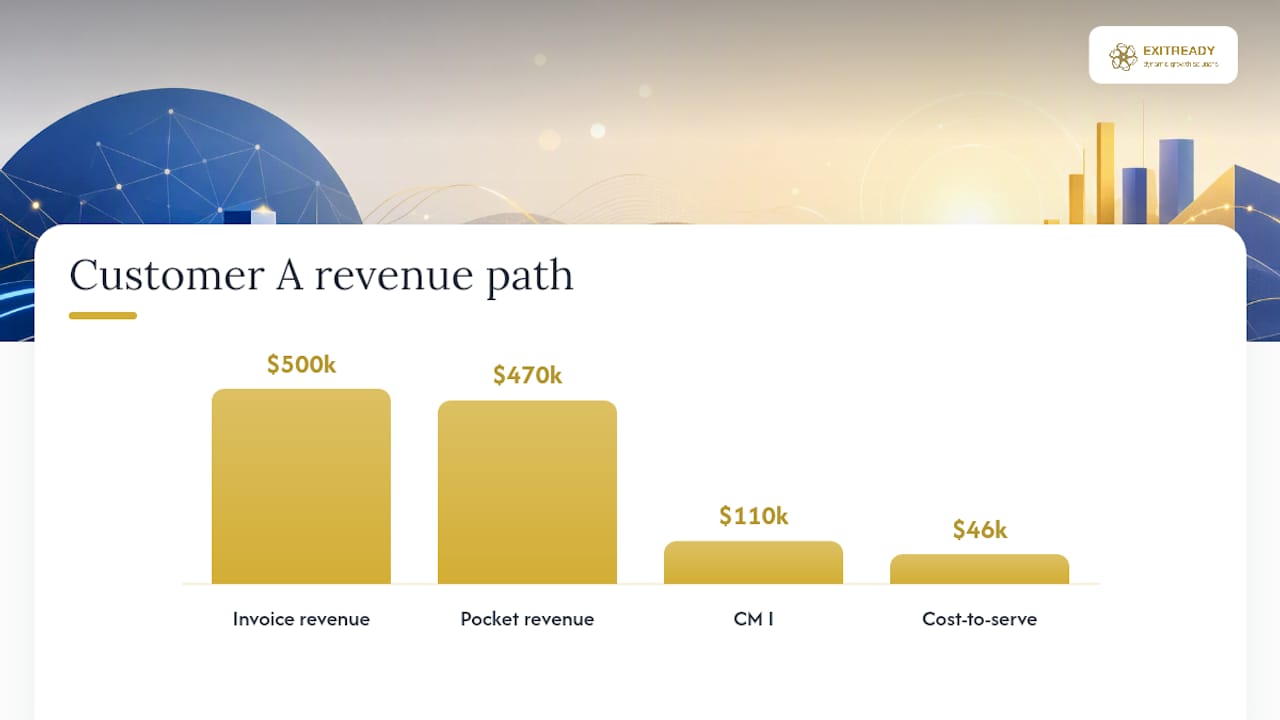
Here’s a compressed example. Customer A invoices $500,000 a year. After discounts and freight, pocket revenue is $470,000. Direct costs and sales expense bring CM I to $110,000. That account placed 400 orders, needed 18 deliveries a month, and generated 60 returns, working out to $46,000 in cost-to-serve. A five-driver rate card like this is the standard building block practitioners use to get from invoice to real margin.
Building a Cost-to-Serve Model That Doesn’t Collapse Under Its Own Weight
Cost-to-serve allocation fails most often not because the concept is hard, but because teams try to track everything and end up maintaining a model nobody trusts. Start narrow.
Pull cost pools from sources you already have:
- Order processing and customer service hours, from your ERP or time-tracking system
- Delivery and freight costs, from logistics or 3PL invoices
- Returns handling, from warehouse or CRM data
- Sales visits and account management time, from CRM activity logs
- Credit and collections cost, from AR aging reports
Build a five-driver rate card first: orders, order lines, deliveries, returns, and service visits. Practitioner templates consistently use this exact structure because it’s granular enough to separate real cost differences between customers without requiring a activity log for every task in the business. It also tends to be the sweet spot for distributors and light manufacturers, where order handling and delivery frequency explain most of the cost variation between accounts.
Expand beyond five drivers only when a specific pattern demands it, such as a customer segment that consumes disproportionate technical support or custom packaging. When the model needs more precision than a simple rate card allows, move to time-driven activity-based costing (time-driven ABC). Instead of tracking every micro-activity, you estimate a cost per hour for a department and multiply it by the time each activity actually takes. That single change keeps the model maintainable because updating it means adjusting one hourly rate and a handful of time estimates, not rebuilding a cost tree. For teams handling fulfillment-heavy portfolios, a deeper cost-to-serve breakdown is worth reviewing before finalizing driver choices.
Turning Rankings Into Action: Protect, Maintain, Reprice, or Exit
A CPA model that doesn’t end in decisions is an academic exercise. Once CM II is calculated for every account, sort customers into tiers and assign an action to each one.
- Vital few (top tier, healthy margin): Protect these accounts aggressively. Assign a named owner, lock in service levels, and look for expansion opportunities rather than discount requests.
- Break-even middle: These accounts usually aren’t broken, just underpriced or over-served. Standardize service levels, tighten order minimums, or introduce tiered pricing so cost-to-serve stops eating the margin.
- Loss-making tail: Set a clear policy threshold, for example a target operating margin of 8 to 10%, and treat anything below it as a candidate for repricing, renegotiation, or exit. Not every loss-making account needs to go; some are strategic or newly won and simply need time.
For accounts flagged for repricing or service changes, document the decision the same way every time: who owns it, what the pilot metric is, and when you’ll review results. A 90-day pilot on a repriced account, tracked against CM II, tells you far more than a policy memo ever will. This is also where retention thinking matters. Before you reprice a mid-tier account into a worse relationship, it’s worth checking whether a targeted retention approach fixes the margin problem without the risk of losing the account entirely.
Running CPA Without Drowning Your Finance Team
Most companies overreach on their first attempt at customer profitability analysis by trying to model every account at once. Don’t.
Start with your top 20 accounts by revenue. That group usually contains the biggest profit surprises, and in practitioner samples, roughly one in five accounts turns out to be unprofitable once costs are fully loaded, despite representing a relatively small share of total invoice revenue. Extend to the top 50 once the model is stable, then move to segment-level analysis for the long tail rather than building a per-customer model for every small account. Teradata’s framework explicitly recommends this segment-based approach when full per-customer analysis isn’t practical at scale.
Assign clear ownership:
- A finance lead owns the model, the data pipeline, and quarterly refreshes
- An operations or account-management lead owns the driver data and the action follow-through
- Monthly dashboards flag red-alert accounts (margin below threshold two months running) between full quarterly refreshes
On tooling, spreadsheets work fine for the first 20 to 50 accounts. Once you’re tracking driver volumes across hundreds of customers, move to a BI report pulling directly from ERP and CRM data, since manual updates at that scale become the point of failure. Whatever the format, the minimum report should show CM II, operating margin %, and month-over-month movement, with a clean handoff to the account team once an account crosses a threshold.
Where Customer Profitability Analysis Breaks Down
CPA is a rear-view mirror. It tells you what happened last quarter, not what a customer is worth going forward, which is why it works best paired with customer lifetime value analysis rather than used alone. A newly signed account might show a poor CM II in month three and still be a strong long-term bet.
Three failure points show up again and again:
- Undocumented discounts and rebates that never make it into pocket revenue, inflating apparent margin
- Missing or noisy driver volumes, especially delivery counts and return rates tracked in disconnected systems
- Sales compensation misalignment, where reps are still paid on revenue while the company tries to act on margin data, creating quiet resistance to any repricing decision
When a driver is missing, use a defensible proxy, like order count standing in for processing time, and test how sensitive the model is to that assumption before you change any customer’s pricing. Pilot every repricing decision on a handful of accounts first. It surfaces pushback and data gaps while the stakes are still small.
How Dynamic Growth Solutions Applies CPA Inside AOS
Inside the Accelerated Operating System, customer profitability analysis isn’t a standalone report, it’s a diagnostic input. A ProfitDriver Analysis builds the cost-to-serve rate card and CM II rankings described above, then feeds the results directly into a business playbook: which accounts get protected, which get repriced, and which service models need to change.
The difference between a CPA spreadsheet and an operational fix is follow-through. Findings that stay in a report change nothing. Findings that get translated into a delegated playbook, with an owner and a timeline, change margin. That translation step is where most internal CPA efforts stall, and it’s the specific gap AOS packages are built to close.
A detailed client example illustrating this process is in development and will be added here.
— Andre
Setting Realistic Profitability Targets by Segment
Benchmarks only work when they’re set per segment, not as one company-wide number. A national account with volume discounts and dedicated support will never carry the same margin percentage as a small, low-touch customer, and holding both to an identical target guarantees you’ll misjudge one of them.
A workable approach sets three benchmark bands.
Review targets at least once a year, and sooner if input costs shift, since a rate card built on last year’s freight or labor costs will understate cost-to-serve the moment those expenses rise. Comparing actual CM II against these targets, rather than against last year’s revenue, is what turns a benchmark from a wall poster into an operating discipline.
What Customer Profitability Analysis Looks Like in Practice
The clearest way to see CPA’s value is through what it uncovers rather than what it promises. A distributor running its first full account-level cost-to-serve model routinely finds that its largest account by revenue sits in the bottom third by margin, once bespoke packaging, rush deliveries, and extended payment terms are loaded against it. That’s not a hypothetical. Harvard Business School’s practitioner materials describe exactly this pattern: high-revenue accounts that look like top performers on a sales report but fall into the loss column once true cost-to-serve is applied.
The corrective action is rarely dramatic. In most documented cases, it’s a renegotiated delivery schedule, a minimum order size, or a shift from custom to standard packaging, changes that a sales team would never propose on its own because the revenue-only view never flagged the account as a problem.
The pattern that matters most for a mid-market leader is the rank reversal. Once you calculate CM II across the full customer base, the ranking rarely matches the revenue ranking, and that mismatch is usually the single fact that gets a leadership team to change how it prices and staffs accounts. It reframes the conversation from “which customers spend the most” to “which customers we should actually be chasing.”
Keeping the Model Current Instead of Letting It Go Stale
A customer profitability model built once and never touched again becomes misleading within two or three quarters, as driver volumes, freight rates, and staffing costs shift underneath it. Treat the refresh cadence as part of the model, not an afterthought.
Run a full recalculation quarterly for your top 50 to 100 accounts, updating driver volumes, activity rates, and pocket revenue for each. Between full refreshes, a lighter monthly check on your red-flag accounts, the ones sitting near or below your margin threshold, catches deterioration before it compounds across a full quarter.
Tie the review to a real trigger, not just a calendar date. A cost pool that jumps (freight costs spiking, a new minimum wage taking effect) should force an off-cycle rate card update, since the alternative is quietly overstating margin on every account touched by that cost. The same applies when a customer’s order pattern shifts meaningfully, more returns, smaller order sizes, additional delivery locations, since that’s exactly the kind of change a stale model misses.
When Customer Profitability Analysis Is Worth Running Now
CPA earns its cost fastest in businesses with complex service models: distributors, light manufacturers, and B2B service firms with variable logistics or support demand. If your cost-to-serve is nearly flat across customers, a segment-level pass or a customer lifetime value analysis will tell you more for less effort. Budget a focused pilot at two to four weeks on your top 20 accounts before scaling further.
— Andre
How Dynamic Growth Solutions Turns CPA Into Margin
Running the calculations above tells you where the margin problem lives. Closing it is a different job, one that usually stalls inside internal teams because nobody owns the follow-through. A ProfitDriver Analysis is an assessment that builds your cost-to-serve rate card, ranks accounts by CM II, and hands you a documented tier list instead of a spreadsheet nobody opens again.

From there, the Growth Sprint, Performance Sprint, and Enterprise Sprint programs turn those findings into operational playbooks, delegated to your team rather than left with the owner, covering repricing, service-model changes, and account exits with a named owner and timeline for each. Expect the outcome to look less like a report and more like a working system: margin recovered on flagged accounts, documented processes your team can run without you, and hours back in your week that used to go to firefighting underpriced accounts. If you want a rigorous, evidence-based read on where your customer base is bleeding margin, schedule a strategy call and start with the diagnostic.
Sources
For the original Harvard research behind the whale curve, see the Balanced Scorecard working knowledge piece. For rate-card templates, review MyRevify’s practitioner guide and Harvest’s implementation walkthrough.
- A Balanced Scorecard Approach To Measure Customer Profitability | Working Knowledge
- What is customer profitability analysis? | Teradata
- Customer Profitability Analysis: 7 Proven Ways To Win Margin | MyRevify
FAQ
What Are the Four Levels of Profitability?
Most CPA models track four levels: gross margin, CM I (after direct sales cost), CM II (after cost-to-serve), and net operating margin, each stripping out a different layer of cost to get closer to true customer-level profit.
What Are the Five Profitability Ratios?
Common ratios include gross margin, operating margin, net margin, return on assets, and return on equity, though for customer-level analysis the ratio that matters most is CM II divided by pocket revenue.
How Do You Determine Customer Profitability?
Calculate pocket revenue, subtract direct costs to get CM I, then subtract cost-to-serve, built from a driver-based rate card, to get CM II, the true measure of what a customer contributes to profit.
Does Dynamic Growth Solutions Offer Customer Profitability Analysis?
Yes. Its ProfitDriver Analysis™ builds a cost-to-serve rate card and ranks customers by margin, with pricing available on request through a direct consultation.
Why Do Profitable-Looking Customers Sometimes Lose Money?
High-revenue accounts often carry hidden costs, custom service, frequent returns, rush delivery, that don’t show up until cost-to-serve is fully allocated, which is exactly what CM II is designed to reveal.
3 Responses