

A leadership team scorecard is a concise weekly snapshot of the handful of numbers that tell you whether the business is on track. Start this week: pick a handful of controllable weekly metrics and give each one a single owner. Below, we show how to choose those metrics, run the weekly pulse, and cascade ownership down to every seat.
TL;DR:
- Pair each major outcome with a leading indicator you can influence soon and a lagging result, then set a weekly target for both.
- Review the scorecard for 10 minutes each week, discuss red or repeatedly slipping yellow metrics, and assign each exception an owner and due date.
- Map each leadership metric to controllable measures owned by seats; if a seat meets its target but the result does not move, replace the measure.
- Before piloting, confirm every owner has the authority and resources to affect the metric, use one source of truth, and schedule a quarterly metric review.
- Include team health indicators alongside execution numbers, such as psychological safety and feedback quality, and choose metric sets around growth, margins, or talent.
Table of Contents
- What does an effective leadership team scorecard include?
- How do you build your leadership team scorecard this quarter?
- How do you run the weekly pulse in leadership meetings?
- How do you cascade leadership metrics into seat-level measures?
- What are the most common scorecard pitfalls, and how do you fix them?
- What templates and sample metric sets can you copy this week?
- Why does this approach work?
- Author perspective: the one corrective every leadership team should adopt
- How we help leadership teams build, pilot, and embed scorecards
- FAQ
- Sources
What does an effective leadership team scorecard include?
Every good scorecard starts with critical numbers: the few measures that move revenue, margin, cash, or customer retention. Everything else is reporting, and reporting is not steering. A scorecard that tries to show everything ends up showing nothing, because leaders stop reading it.
Balance two kinds of indicators:
- Lagging indicators report results after the fact. Examples: monthly revenue and gross margin.
- Leading indicators predict those results while you can still act. Examples: qualified proposals sent this week and open-role days to fill.
A practical rule of thumb is to keep the leadership team scorecard focused. Too few metrics can leave blind spots, while too many can pull the meeting into debate over data instead of decisions.
Keep the format concise: metric, owner, weekly target, status color, and a short note. If someone needs a legend to read it, simplify it.
Researchers who studied top management teams found that focused communication in meetings predicts task performance, relationship quality, and member satisfaction. A tight one-page scorecard is a focus tool: it keeps the room on the numbers that matter.
How do you build your leadership team scorecard this quarter?
Work through five steps in order. Most teams can finish the first steps in a couple of working sessions.
- Identify a focused set of critical numbers. Tie each one to a company goal or revenue driver. If a number does not connect to a goal, leave it off. A short alignment session helps here, and our guide to a leadership alignment workshop shows how to agree on what belongs.
- Choose leading and lagging indicators and set weekly targets. Pair each outcome with at least one predictor you can influence soon enough to influence the outcome. Set the target as a weekly number, not a quarterly aspiration.
- Assign one owner per metric. Name the controllable action that owner reports each week. Shared ownership means no ownership. Our decision rights matrix is a handy way to confirm each owner has real authority.
- Design the one-page layout and confirm data sources. Decide where each number comes from and who refreshes it. If a figure takes too long to assemble, find a faster source.
- Pilot the scorecard. Run the scorecard in every weekly leadership meeting, then adjust. Drop metrics nobody acts on and sharpen targets that were too easy or too hard.
Pro Tip: Write each owner’s weekly action in a verb-first sentence, such as “Call the largest overdue accounts,” so the report describes behavior, not just a number.
Keep the scorecard tied to your plan. If you need a framework for connecting metrics to strategy, our strategy execution framework walks through the quarterly logic.
How do you run the weekly pulse in leadership meetings?
The scorecard only works when the same group reviews it at the same time every week. Practitioners describe high-performance teams as integrating scorecards into a structured cadence, such as Rockefeller Habits or Level 10 Meetings. A simple version looks like this:
- Open with a good-news round. Each leader answers one question: what made it a good week?
- Review the scorecard (10 minutes). Each owner states their number and status in one sentence. No storytelling for green items.
- Discuss only the exceptions. Red metrics, or yellow metrics that have repeatedly slipped, get airtime. Everything else moves on.
- Assign actions. Each exception becomes a short, owned action with a due date, and the owner updates it next week.
Use simple traffic-light rules. Green means at or above target. Yellow means within a tolerance you agree on in advance. Red means below it, and persistent red status triggers escalation to the full team.
A weekly rhythm also protects you from surprises. A problem that would have surfaced in a quarterly review appears soon enough to influence the outcome, while it is still small.
Pro Tip: Cap the meeting at 45 minutes and end it on time. A hard stop forces owners to arrive prepared.
How do you cascade leadership metrics into seat-level measures?
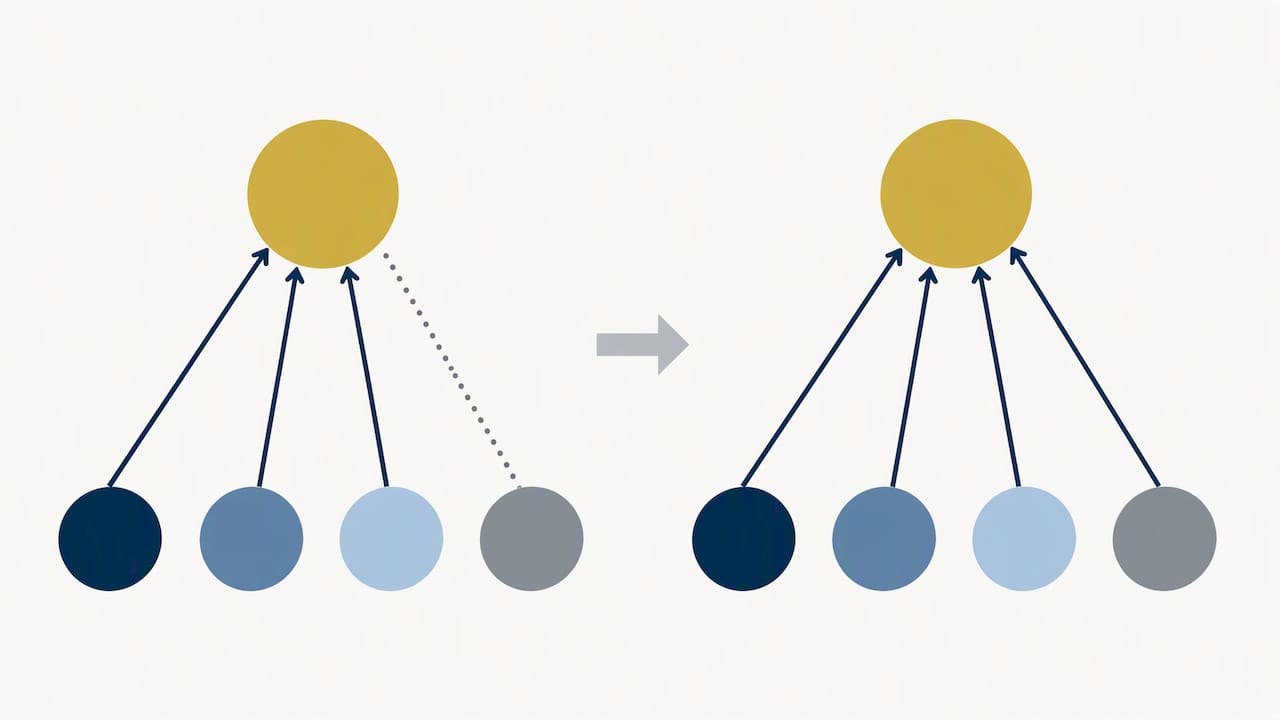
A leadership number only changes behavior if someone below the leadership table can influence it. The cascading principle is simple: every leadership metric maps to one or more controllable measures owned by a specific seat. This is how teams close the “last-mile accountability gap” that practitioners describe, where every seat owns a clear weekly metric.
Write each seat-level measure with the same four parts:
- Metric: the number, stated plainly.
- Owner action: what the person does that moves the number.
- Data source: where the figure is recorded.
- Weekly target: the level that counts as on track.
Here is how it plays out. If the leadership metric is on-time delivery rate, the operations seat might track orders shipped within promised dates, while the purchasing seat tracks supplier confirmations received by Wednesday. If the leadership metric is new pipeline, a sales seat tracks discovery calls held and a marketing seat tracks qualified leads handed over.
During the pilot, review cascaded measures regularly. If a seat hits its target but the leadership number does not move, the measure is wrong, not the person. Replace it with one that has a stronger link to the outcome.
What are the most common scorecard pitfalls, and how do you fix them?
Most failing scorecards share a few predictable problems:
- Too many metrics. Cut back to the numbers that predict outcomes. If a metric never triggers a decision, remove it.
- Only lagging indicators. You learn about problems after they cost you. Add a leading measure tied to an owner action for each major outcome.
- Ownership without authority. An owner who cannot spend, hire, or decide cannot move the number. Agree on accountabilities and resources before the pilot starts.
- Messy data. Pick a single source of truth, automate pulls where you can, and assign someone to run a quick data check before each meeting. Arguing about whether a number is right wastes the time you set aside to discuss what to do about it.
Teams also drift into set-and-forget mode. Put a quarterly review of the metric list on the calendar so the scorecard keeps pace with the strategy.
What templates and sample metric sets can you copy this week?
Start with a one-page grid. Rows are metrics. Columns are metric name, owner, weekly target, status color, and owner action. Then fill it from a sample set that matches your priority:
- Growth: qualified proposals sent, win rate on open proposals, new pipeline created, and monthly recurring revenue.
- Margin and efficiency: gross margin by service line, hours billed versus capacity, rework hours, and days sales outstanding.
- Talent and retention: long-standing open roles, voluntary turnover, one-on-ones completed, and a short team-health pulse.
Research on top teams supports including that last group. In a study of CEO relational leadership, trust and learning from failure improved strategic decision quality, which is why a scorecard should pair hard execution numbers with soft indicators such as psychological safety and feedback quality.
A mini scenario shows the format. The owner of proposals reports: “Proposals sent: 6 against a target of 10, status red. Cause: two estimators out sick. Action: borrow one estimator from delivery through Friday, update next week.” That is the whole report.
If you want a readiness diagnostic to decide where to start, our Growth Readiness Score Card helps prioritize.
Why does this approach work?
Three lines of evidence support the design. First, the research on top management teams links focused communication to better task performance and satisfaction, which supports a concise weekly pulse. Second, the study of CEO relational leadership supports balancing execution metrics with team-health indicators. Third, assessment data from the Center for Creative Leadership show direction, alignment, and commitment strongly predict team outcomes, which is what cascaded, owned metrics reinforce.
Author perspective: the one corrective every leadership team should adopt
The misuses I see most often are overtracking, weak ownership, and data that arrives too late to matter. A scorecard with too many rows is a filing system, not a steering tool. My corrective is deliberately small: give each seat a weekly lead measure, tied to the owner’s weekly report and a brief verbal update. If you want a second set of eyes, we offer a diagnostic that shows where your current scorecard leaks.
— Andre
How we help leadership teams build, pilot, and embed scorecards

We turn this guide into a working weekly cadence for mid-market teams. Here is how our services map to the work:
- Enterprise Assessment: we diagnose where your numbers and ownership break down.
- Growth Sprint: we build and pilot the scorecard with your team.
- ProfitDriver Analysis™: we find the margin levers worth tracking.
The usual path is diagnostic, then pilot, then embed. Ready to start? Submit an application.
FAQ
What is a leadership team scorecard in simple terms?
It is a concise weekly view of the key numbers that show whether your business is on track. Each number has one owner and a clear weekly target.
How many metrics should a leadership scorecard have?
Aim for a focused set of metrics. That is enough to cover revenue, margin, cash, customers, and people without burying the team in data.
How often should a leadership team review its scorecard?
Weekly. A weekly review surfaces problems while they are small, and focused meeting communication is linked to stronger task performance in top management teams.
What is the difference between leading and lagging indicators?
Lagging indicators, such as revenue, report results after they happen. Leading indicators, such as proposals sent this week, predict those results while you can still change them.
Who should own each metric on the scorecard?
One named person who has the authority and resources to move the number. Shared ownership usually means nobody follows up.