

A swimlane process map is a cross-functional flowchart that assigns every step to a role, team, or system so you can see who owns each handoff and where work stalls. Managers use it to expose the exact point where a claim, order, or approval sits waiting for someone who doesn’t know it’s their turn. It works best as a facilitated exercise with the people who actually do the work, not a diagram drawn alone at a desk.
TL;DR:
- Most maps should include no more than 5 to 8 lanes to maintain clarity, with a maximum of 20 to 25 steps for readability.
- Label each handoff with the transferred item, format, and expected completion time, and highlight problem handoffs prominently.
- Create the process map collaboratively in a timeboxed session, focusing on identifying ownership, sequence, and handoffs before addressing issues.
- Assign stable IDs to each step beforehand and use a sheet-based approach to enable easier updates as processes evolve.
- Follow-up actions should always include clear owners and deadlines for red handoffs, ensuring mapping efforts lead to meaningful process improvements rather than static diagrams.
Table of Contents
- What Is Swimlane Process Mapping, Exactly?
- Why Map Ownership and Handoffs at All?
- The Essential Components Checklist
- How to Create a Swimlane Process Map, Step by Step
- Design Rules That Keep Maps From Becoming Shelfware
- Examples and Templates You Can Adapt
- How This Fits Into a Documented Operating System
- An Editorial Take on Running These Sessions Well
- Ready to Turn Your Map Into a Documented System?
- Sources
- FAQ
What Is Swimlane Process Mapping, Exactly?
The diagram gets its name from the horizontal or vertical bands, or lanes, that split the page. Each lane belongs to one role, department, or system, and every activity in the process sits inside the lane of whoever performs it. A pool is the outer container that holds all the lanes for one end-to-end process. Inside the pool, rectangles mark activities, diamonds mark decisions, and rounded shapes mark start and end points. Arrows crossing from one lane into another represent handoffs, and those crossings are the whole point of the exercise.
Most teams draw lanes horizontally, stacked top to bottom, though vertical orientation works fine when a process has many steps but few participants. The notation borrows from Business Process Model and Notation (BPMN), the formal standard used for process automation, but a swimlane map doesn’t need BPMN’s full rule set to be useful.
Key elements to recognize on any map:
- Lane: one row or column representing a single role, team, or system.
- Pool: the boundary containing the entire process and all its lanes.
- Activity: a rectangle showing one task or step.
- Decision: a diamond showing a branch point, usually yes/no.
- Handoff: an arrow that crosses a lane boundary, the single most important thing to track.
Why Map Ownership and Handoffs at All?
The value isn’t the picture; it’s what the picture forces a team to admit out loud, as explored in the Care Management Workflow Design: A Product Team Playbook. It’s what the picture forces a team to admit out loud: who actually owns step 14, and why nobody picked up the file for three days after legal signed off. Swimlane diagrams make accountability visible in workflows that cross more than one department, which is exactly where responsibility usually gets fuzzy.
They’re also a diagnostic tool. Delays, rework loops, and missed service-level agreements almost always cluster around handoffs, not individual tasks, and swimlane diagrams are particularly effective at exposing those crossing points before they turn into a pattern of missed deadlines.
Common places this pays off:
- Employee onboarding, where HR, IT, and the hiring manager each own different steps.
- Insurance or warranty claims processing, where approvals bounce between departments.
- Order-to-cash cycles, from sales handoff to fulfillment to billing.
- IT operations, tracking a ticket from intake through resolution.
- Building a standard operating procedure (SOP) that new hires can actually follow.
The Essential Components Checklist
Before a mapping session starts, get the symbol set and lane rules straight. A shared vocabulary keeps six people from drawing six different styles on the same whiteboard.
Standard symbols to use consistently:
- Rectangle: an activity or task.
- Diamond: a decision point with multiple paths.
- Circle or oval: start and end points of the process.
- Arrow: direction of flow; a heavier or colored arrow for handoffs.
Pools separate distinct end-to-end processes; lanes divide one pool by who does the work. Get the orientation decision out of the way early, since switching mid-session wastes time.
Granularity is where most maps go wrong. Label lanes by role or function, such as “Sales Rep” or “Billing System,” never by an individual’s name.
Pro Tip: If two people share a lane but do genuinely different work, split the lane. A shared lane hides the exact accountability gap you’re trying to expose.
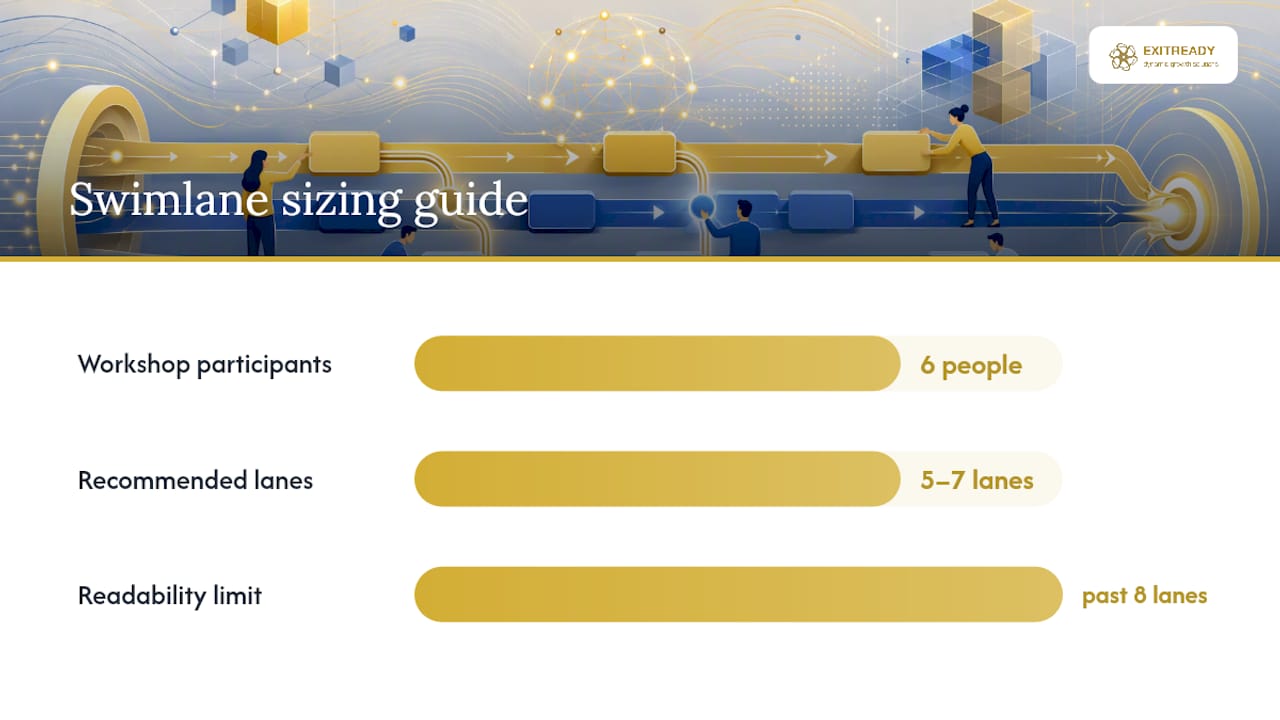
Practitioner guidance settles on a practical ceiling of about 5 to 7 lanes for readability, with diagrams becoming hard to follow past 8. Every lane crossing needs a label describing what’s transferred and how long it should take. Unlabeled crossings are the most common reason a finished map ends up ignored.
How to Create a Swimlane Process Map, Step by Step
Run this as a working session, not a presentation. The goal is a draft the room agrees on by the end of the meeting, not a polished file someone finishes alone afterward.
- Define scope and goals. Pick one process, name its start and end points, and write the goal on the whiteboard before anyone draws a box. Keep the session timeboxed. Medium-complexity processes typically need 60 to 90 minutes with the right participants in the room, and the exercise usually surfaces problems before the map is even finished.
- Identify participants and assign lanes. List every role or system that touches the process, then create one lane per role, never per person. If the sales team and account management both touch order intake, they get separate lanes even if the same person currently covers both jobs.
- Collect and sequence the steps. Walk through the process chronologically, sticky note by sticky note, and assign each step to the lane of whoever performs it. This is faster with actual participants in the room than with an outside facilitator guessing.
- Draw handoffs and decisions. Mark every place an arrow crosses a lane boundary, and label exactly what transfers and the expected turnaround time. Add decision diamonds for branches and note where steps run in parallel rather than in sequence.
- Validate with participants. Walk the finished draft past everyone who contributed. Mark any handoff where people disagree on ownership or timing in red. Those red marks become your priority list.
Pro Tip: Don’t fix problems during the mapping session itself. Capture every red handoff, finish the map, then tackle fixes in a separate follow-up meeting with clear owners and deadlines.
The full method, including notation choices for actions, decisions, and start/end points, follows the approach outlined by Venngage’s swimlane process map guide.
Design Rules That Keep Maps From Becoming Shelfware
A map that sits in a shared drive untouched for a year wasted everyone’s time in that workshop. A few design habits prevent that.
- Keep every lane label at the role or function level, and hold that granularity consistent across the whole map.
- Stick to 5 to 8 lanes; if you need more, the process probably belongs in two maps, not one.
- Label every handoff with what’s being transferred, in what format, and by when.
- Highlight problem handoffs visually, whether that’s a red arrow, a bold border, or a comment flag.
- Build the map from a spreadsheet or TSV file with stable step IDs rather than freehand drawing, so it can be regenerated after a process changes instead of redrawn by hand.
That last point matters more than it sounds. Import-first rendering from a dataset keeps a map’s version history intact and lets you regenerate it automatically once a step changes, instead of hunting for the one person who knows how to open the original file.
Pro Tip: Assign each step a permanent ID (S1, S2, S3) in your source spreadsheet before you ever draw a box. Renumbering steps after the fact is the single biggest reason maps stop getting updated.
Examples and Templates You Can Adapt
A basic claims process usually runs through five lanes: Customer, Intake Team, Adjuster, Approval Manager, and Payment System. The critical handoff sits between Adjuster and Approval Manager, where claims above a dollar threshold need sign-off, and that’s exactly the crossing worth labeling with a turnaround SLA.
An order-to-cash map typically needs Sales, Fulfillment, Billing, and Finance lanes, with the riskiest handoff at the Fulfillment to Billing boundary, where shipment confirmation has to trigger an invoice.
Working from a TSV or spreadsheet template speeds this up considerably. Example repositories with branch, approval, and rework-loop patterns give you rows to copy and adapt rather than building from a blank canvas.
- Give every step a stable ID before mapping starts.
- Split into sub-processes once a single map exceeds roughly 20 to 25 steps.
- Document exceptions (rare paths, manual overrides) as a separate note attached to the relevant step, not as extra lanes.
How This Fits Into a Documented Operating System
A swimlane map is a diagnostic, not an end product. The real payoff comes when it feeds a documented playbook that replaces tribal knowledge with a written standard someone new can follow on day one. That’s the same logic behind building a lead to cash map or laying out a business process hierarchy that shows how individual swimlane maps roll up into a full operating system.
Outputs a good mapping session should produce:
- A written role description for each lane, independent of who currently fills it.
- A delegation matrix showing who’s authorized to approve what, at which dollar or risk threshold.
- A short list of pilot fixes for the red handoffs, each with an owner and a deadline.
- A version-controlled source file, not a static image, so the map can be updated as the process changes.
Companies that turn these maps into consistent, documented processes are the ones that show up in reviews of systematized businesses built to scale without the owner personally approving every exception.
An Editorial Take on Running These Sessions Well
Most swimlane sessions fail for a boring reason: they run too long. Ninety minutes is the outer edge for a medium-complexity process, and past that point people start agreeing to things just to leave the room. Timebox it hard, and if you’re not done, schedule a second session rather than pushing past two hours.
Split the diagram the moment it exceeds roughly 20 to 25 steps or 8 lanes. A map that big stops being a communication tool and starts being a wall chart nobody reads closely.
The real failure mode isn’t a bad map. It’s a good map that never turns into action. Every red handoff needs a named owner and a deadline within a week of the session, or the exercise was theater. If a mapping session ends without that list, don’t count it as finished, no matter how clean the diagram looks. A tool like Miro or Confluence can host the working file, but the software isn’t what makes the map matter. The follow-up meeting is.
— Andre
Ready to Turn Your Map Into a Documented System?
A swimlane map tells you where the handoffs fail. Turning that into a durable fix, a written playbook, a delegation matrix, and a process that runs without the owner in the room, is a different kind of work. A proprietary business operating system can take the diagnostic work of process mapping and convert it into documented, ownership-clear operations that reduce owner dependency and hold up under buyer due diligence. If your team just finished a mapping session and is staring at a list of red handoffs with no clear next step, explore Dynamicgrowthsolutions’ business transformation approach to see how that diagnostic work turns into a system built for growth and, eventually, a premium exit.
Sources
- Business analysis site: Swimlane mapping page
- Venngage: How to create a swimlane process map
- SI Labs: Swimlane diagram guide and practical example
FAQ
How Do You Create a Process Map With Swimlanes?
Scope the process, list every participant role, sequence the steps chronologically, assign each step to its lane, mark and label every handoff, then validate the finished draft with the people who do the work.
What Are the 5 Levels of Process Mapping?
Definitions vary across frameworks, but a common version runs from a high-level value chain, down through process groups, individual processes, detailed swimlane workflows, and finally granular work instructions or SOPs.
What Is the Difference Between a Flowchart and a Swimlane Diagram?
A standard flowchart shows steps in sequence without assigning ownership, while a swimlane diagram adds lanes that assign every step to a specific role, team, or system, making handoffs visible.
Can You Show Me a Flowchart With Swimlanes?
Picture a claims process with five lanes: Customer, Intake, Adjuster, Approval Manager, and Payment System. Rectangles mark each task, and an arrow crossing from Adjuster to Approval Manager marks the critical handoff needing an SLA label.