

The SKU rationalization process is a systematic review of every product you sell, scored against sales velocity, margin, and true cost to serve, so you can cut, consolidate, or reposition items that are draining cash without hurting revenue. Done right, it lowers carrying costs, frees warehouse and cash flow, and shifts your margin mix toward the products actually earning their shelf space. This guide walks through the metrics, the scoring framework, the rollout steps, and the governance cadence that keeps the work from unraveling six months later.
TL;DR:
- SKU rationalization should focus on removing or consolidating SKUs that cost more to serve than they generate in profit, especially low-margin or slow-moving items.
- Key metrics include sales velocity, direct product profitability, return rates, days of inventory on hand, and attach rates to other SKUs, with cost-to-serve analysis critical for accurate assessment.
- The process involves scoping, data cleaning, ranking SKUs, making and piloting decisions, and ensuring operational updates to prevent stalls and rework.
- Building a simple scorecard with weighted metrics and establishing clear decision thresholds helps automate and defend SKU reductions without relying on gut feeling.
- Effective governance requires assigning clear owners for each implementation step and reviewing decisions quarterly to maintain progress and avoid internal vetoes.
Table of Contents
- What Is SKU Rationalization and Why It Matters
- Metrics and Data You Need Before You Score Anything
- What Are the Steps in the SKU Rationalization Process?
- How Do You Build a Scorecard for SKU Decisions?
- Turning Decisions Into Action Across the Business
- Advanced Analytics: Component Complexity and Demand Transference
- A Governance Checklist Built for Limited Leadership Bandwidth
- What This Process Actually Rewards, and What It Punishes
- When to Bring in a Partner for SKU Rationalization
- Sources
- FAQ
What Is SKU Rationalization and Why It Matters
SKU rationalization means systematically reviewing your product catalog and removing, consolidating, or repositioning items that cost more to carry than they return. It’s not the same as a fire sale on slow movers. The goal is a leaner catalog that still covers what customers actually want.
Most mid-market catalogs carry SKU bloat for a mundane reason: nobody ever says no to a new variant.
The benefits show up fast once you start cutting the right things:
- Lower inventory carrying costs from less safety stock, fewer obsolete units, and reduced warehouse footprint
- Fewer picking and fulfillment errors because staff aren’t hunting through near-duplicate SKUs
- Better margin mix, since the cash and shelf space that once supported laggards now flows to your best performers
- Simpler purchasing and supplier negotiations with a smaller, more predictable order book
The mistakes are just as consistent. Sales or product leaders veto cuts on their own turf. And nobody accounts for the strategic SKU that loses money but anchors a customer relationship worth protecting.
Metrics and Data You Need Before You Score Anything
You can’t rationalize on gut feeling. The ThoughtSpot data-driven SKU rationalization framework starts with data collection for good reason: any scoring model built on incomplete numbers will make confident, wrong recommendations.
Pull these metrics for every SKU in scope, at minimum:
- Sales velocity and units sold over a trailing 12-months (longer for seasonal categories)
- Gross margin and, critically, direct product profitability (DPP) after cost to serve
- Return rate and return reason codes
- Days of inventory on hand and inventory turns
- Cost-to-serve, covering pick cost, storage, and freight allocation
- Attach rate to other SKUs, since a low-margin item can still be justified if it drives a high-margin bundle
Pro Tip: Pull cost-to-serve, not just gross margin. A SKU can look profitable on paper and still lose money once you allocate real picking, storage, and freight costs against it. Our cost-to-serve analysis guide walks through the calculation.
Source the raw numbers from your ERP or item master, point-of-sale system, warehouse management system, purchasing records, returns logs, and supplier contracts. Reconcile them before scoring anything: mismatched item numbers between your POS and WMS will quietly corrupt the whole exercise. Segment by channel, product lifecycle stage, and region before you rank, since a SKU that’s dying in retail might be thriving direct-to-consumer. RELEX Solutions notes that DPP paired with demand-transference modeling is what separates a defensible rationalization from a guess.
What Are the Steps in the SKU Rationalization Process?
The process runs in six stages, and skipping straight to “decide” is the single most common way mid-market teams sabotage the effort.
- Scope and set objectives. Pick one category or one region for a pilot, not your entire catalog. Define success upfront: a target reduction in days-on-hand, a margin lift percentage, or a pick-error rate you want to hit.
- Collect and clean the data. Pull the metrics above for a full seasonal cycle where possible. Flag and fix duplicate item numbers, missing cost-to-serve fields, and inconsistent UPC assignments before you rank anything.
- Segment and rank. Group SKUs into velocity tiers (A, B, C) and layer in DPP by tier. A SKU can rank low on units sold and still land in your A tier once cost-to-serve and margin are factored in.
- Decide and assign actions. Each SKU gets one of five outcomes: keep, consolidate into a broader variant, bundle with a stronger seller, discount and clear, or discontinue outright.
- Pilot the changes. Run the first wave on the scoped category only. A typical first-wave pilot changes 10 to 20% of in-scope SKUs, with steady-state maintenance settling into 3 to 8% of the catalog per quarter after that.
- Execute and monitor. Roll changes into purchasing, the item master, and product pages, then watch days-on-hand, contribution margin, and pick-error rate for signs the cuts are working, or set a rollback trigger if a “discontinued” SKU turns out to drive disproportionate basket size.
Set your rollback trigger before you launch, not after a supplier or sales rep complains. A simple rule works: if a discontinued SKU’s dependent products show a revenue drop greater than the SKU’s own contribution within 60 days, reinstate it and flag it for the annual review instead of the quarterly one.
How Do You Build a Scorecard for SKU Decisions?
A scorecard turns the metrics into a repeatable, defensible score instead of a debate. Weight each factor based on what actually drives your business, then apply a threshold that triggers action automatically rather than case by case.
A workable starting model looks like this:
- Sales velocity (25% weight): trailing 12 month units and trend direction
- Margin after cost-to-serve (30% weight): DPP, not gross margin alone
- Uniqueness or component overlap (20% weight): does removing it free up real complexity, or does it share tooling with a top seller?
- Attach value (15% weight): revenue it protects in other SKUs through bundling or cross-sell
- Return rate (10% weight): a proxy for quality issues or customer confusion
New launches and seasonal items need separate thresholds. A three-month-old SKU with thin sales data isn’t a rationalization candidate, it’s a product still finding its footing, and Bain’s research on portfolio simplification stresses evaluating the full portfolio rather than penalizing anything young or seasonal on raw velocity alone.
Every override needs a name attached, a written reason, and a review date, typically the next quarterly cycle, or exceptions quietly become permanent and the scorecard loses its authority.
Turning Decisions Into Action Across the Business
A scorecard decision means nothing until purchasing, warehousing, and your website all reflect it. This is where most rationalization efforts actually die: the analysis was solid, but nobody updated the reorder points.
Work through this checklist for every SKU marked for consolidation or discontinuation:
- Stop future buys and cancel open purchase orders where possible
- Re-slot the warehouse to consolidate remaining inventory and free pick locations
- Update product detail pages and remove discontinued items from active search and category listings
- Build a clearance plan with a firm markdown schedule and end date, not an open-ended discount
- Notify suppliers in writing with lead time for their own inventory planning
- Retire the identifier properly, following GS1’s guidance on UPC management so a retired UPC never gets reassigned to a new item and corrupts historical sales data
Assign a named owner to each task, purchasing owns the buy stop, warehouse ops owns re-slotting, marketing owns the PDP update, so nothing sits in a gap between departments. Send suppliers a short written notice rather than a phone call; it gives them something to act on and you a paper trail if a dispute comes up later. If your item master lives across multiple systems, confirm the change propagates through your ERP platform before you announce anything internally.
Advanced Analytics: Component Complexity and Demand Transference
McKinsey’s research on portfolio management points to network-optimization and component-clustering methods instead, ones that identify which SKUs to prune to free the most unique components while losing the least sales.
The right question isn’t which SKUs sell the least. It’s which SKUs you could remove that would simplify your operations the most while costing you the least in lost revenue. Those are rarely the same list.
Market-basket analysis helps answer the harder question: if you kill this SKU, do customers switch to something else you sell, or do they walk? Demand-transference modeling estimates that substitution before you cut, which protects unique SKUs that look weak in isolation but capture sales nothing else in your catalog can.
- Component reuse across SKUs multiplies the operational payoff of each cut
- Network-optimization tools outperform manual “sort by revenue” reviews in complex catalogs
- Market-basket models flag SKUs where a cut risks losing the customer entirely, not just the sale
A Governance Checklist Built for Limited Leadership Bandwidth
Mid-market owners don’t have a dedicated portfolio team, so the checklist has to be short enough to actually run. Assign one decision owner, review the scorecard quarterly for fast-moving categories, and do a deeper annual pass timed to your buying cycle. Keep exceptions documented with a review date attached, or they’ll outlive the reasons you granted them.
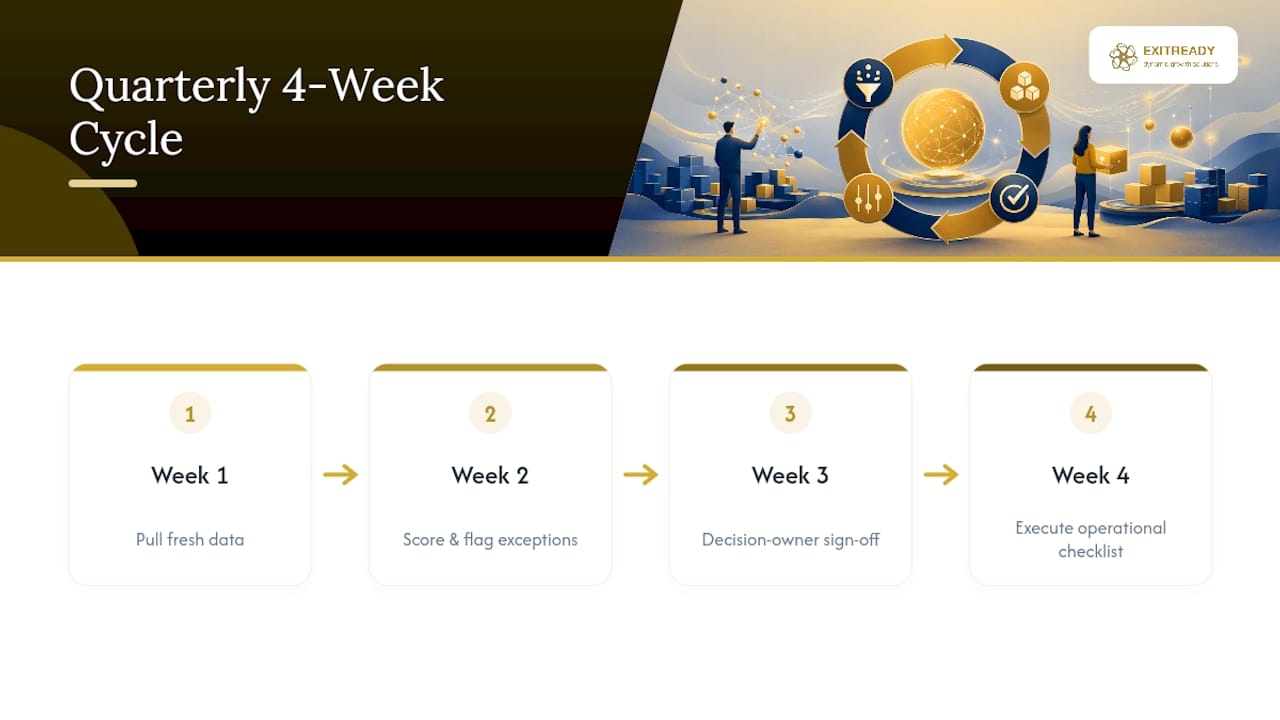
A realistic quarterly calendar: week one pulls fresh data, week two scores and flags exceptions, week three gets sign-off from the decision owner, week four executes the operational checklist. That’s the whole cycle, repeatable without adding headcount.
What This Process Actually Rewards, and What It Punishes
The research keeps pointing to the same uncomfortable truth: SKU rationalization fails most often not from bad analysis but from bad governance. Bain’s finding that cross-functional teams need a single decision owner to avoid political vetoes isn’t a nice-to-have process footnote. It’s the difference between a scorecard that gets used and one that gets argued into irrelevance by whichever department has a SKU on the chopping block.
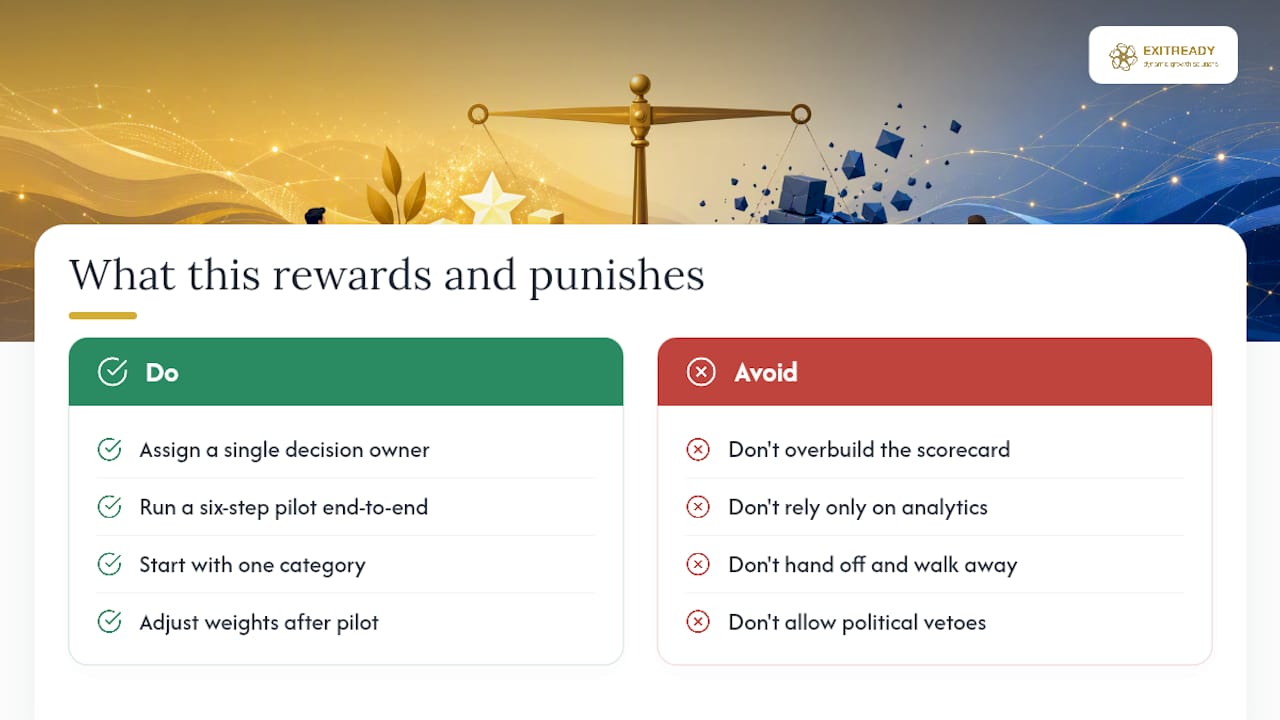
Conventional advice oversells the analytics phase and undersells execution. Plenty of consultants will hand a mid-market owner a beautiful scorecard and walk away. The scorecard was never the hard part. Getting purchasing to actually stop the buy, getting the warehouse to re-slot, getting the website updated before a customer orders something that’s been discontinued for three weeks, that’s where most rationalization efforts quietly stall.
If you’re running your first pilot, resist the urge to build the perfect scorecard before you touch a single SKU. Pick one category, run the six-step process end to end, and fix the scorecard weights after you see how the first round of decisions actually played out against real results. Overcomplicating the first two pilots is the most common way owners never get past the planning phase.
— Andre
When to Bring in a Partner for SKU Rationalization
A rigorous, data-first diagnostic before any recommendation is made, not a generic template applied to your catalog, is critical to success in SKU rationalization. If your item master is scattered across three systems, your product and sales teams disagree on which SKUs are “strategic,” or margin pressure means you need results this quarter rather than next year, that’s exactly when outside execution capacity pays for itself faster than building it internally.

The ProfitDriver Analysis™ service maps cost-to-serve and true product profitability across your catalog, the same DPP and demand-transference data this guide walks through, delivered as a structured assessment rather than a spreadsheet you have to build yourself. From there, a Growth Sprint or Performance Sprint engagement puts hands on the operational checklist: re-slotting, system updates, supplier notices, and the governance cadence that keeps the work from unraveling after the first quarter. Start with the ProfitDriver Analysis™ to see where your margin is actually hiding before you commit to a full rationalization pilot.
Sources
For deeper research behind this guide, Bain’s work on portfolio simplification and McKinsey’s component-clustering analysis cover the strategic side. RELEX Solutions has a practical breakdown of DPP and demand transference, and GS1’s UPC management guide covers the identifier hygiene side of retiring products.
- How to Build a Winning Portfolio | Bain & Company
- Finding the sweet spot in product-portfolio management | McKinsey & Company
- SKU rationalization: How and why to narrow assortments | RELEX Solutions
FAQ
What are the five stages of the inventory management process?
Most frameworks cover procurement, storage, tracking (SKU-level velocity and stock levels), order fulfillment, and reporting or reordering. SKU rationalization sits inside the tracking and reporting stages, since it depends on clean velocity and cost data from those steps.
What does “rationalization” mean in a business context?
Rationalization means systematically reviewing a set of items, whether products, suppliers, or processes, against defined criteria and removing or consolidating the ones that don’t justify their cost or complexity. Applied to a product catalog, it’s the SKU rationalization process itself.
What is the difference between a SKU and a KPI?
A SKU (stock keeping unit) is a unique identifier for a specific product variant, like a shirt in a specific size and color. A KPI (key performance indicator) is a metric, like sales velocity or gross margin, used to measure how well that SKU is performing.
What is the 80/20 rule in inventory management?
The 80/20 rule holds that roughly 80% of your sales or profit typically comes from around 20% of your SKUs. It’s a useful starting lens for prioritizing which SKUs to analyze first, though a full scorecard using DPP and cost-to-serve gives a more accurate picture than revenue share alone.
How much does a SKU rationalization assessment cost?
Pricing depends on scope and engagement type. Current pricing for Dynamicgrowthsolutions’ Growth Sprint and Performance Sprint engagements, which can implement a rationalization pilot, is listed on the Sprint Plus page.