

Pareto analysis ranks the causes of a problem, or the sources of a result, from biggest to smallest, so you can see which few items deserve your attention first. In a business, it usually means sorting customers, products, defects, delays or expenses by their impact and finding the short list that drives most of the outcome. You can run one in a spreadsheet in an afternoon. The hard part is choosing the right measure and acting on what you find.
This guide covers how to build the analysis, how to read it, a worked example with numbers, where owners go wrong, and when you have outgrown the basic version.
TL;DR
- Pareto analysis sorts causes by impact (cost, revenue, time or frequency) and shows the “vital few” that produce most of the result.
- The 80/20 split is a rule of thumb. Your data may show 70/30, 90/10 or something steeper. The finding is the imbalance, not the ratio.
- Rank by cost or profit, not just by how often something happens. A rare problem can be the expensive one.
- A Pareto chart tells you where to look. It does not tell you why. Pair it with root-cause work and then document the fix so it sticks.
- Rerun it on a schedule. The vital few change as your business does.
Table of Contents
- What Pareto analysis is, and where it comes from
- Where owners use it: five business examples
- How to run a Pareto analysis in six steps
- A worked example with numbers
- How to read the chart
- It is not always 80/20
- Five mistakes that make a Pareto chart misleading
- When basic Pareto is not enough
- Our perspective: the vital few usually include the owner
- Turning the analysis into a result
- A simple 30-day plan
- FAQ
- Sources
What Pareto analysis is, and where it comes from
The idea is named after Vilfredo Pareto, the Italian economist who documented how unevenly wealth was distributed. It reached business through quality management. Joseph Juran popularized the principle in his quality work, and the literature stresses that his interest was in finding the causes behind problems and driving systematic improvement, not in a curiosity about distributions.
Today the tool has a firm place in the toolbox. The American Society for Quality describes a Pareto chart as a bar graph that ranks causes or problems from most to least significant, and lists it among the seven basic quality tools. It is also a foundation of Lean thinking: research on operational efficiency describes the principle as a diagnostic for separating the vital few sources of waste from the trivial many, the approach associated with the Toyota Production System.
For an owner, the practical meaning is simple. Your time, cash and team attention are limited. Most businesses spread them evenly across everything. Pareto analysis shows you where an even spread is wasteful.
Where owners use it: five business examples
The same method works on any list where each item has a number attached. These are the uses we see most often in mid-market companies.
- Customers. Rank customers by gross profit, not revenue. A handful usually carry the company, and a long tail may cost more to serve than it earns.
- Products and SKUs. Find the few lines that produce most of your margin, and the many that add complexity, inventory and changeovers.
- Defects and rework. Rank causes by what they cost in scrap, labor and credits. This is the classic use in manufacturing.
- Delays and late orders. Tally late shipments or missed deadlines by cause: supplier, scheduling, approvals, handoffs.
- Owner’s time. Log where your own week goes. Many owners discover that a few recurring decisions consume most of their hours, which makes them prime candidates for delegation.
Sales teams use the same logic on lead sources and lost deals. A win-loss analysis gives you the category data (why deals were lost, to whom, at what stage) that you can then rank in a Pareto chart.
How to run a Pareto analysis in six steps
The calculation method below follows the procedure in Oregon State University Extension’s guide to Pareto analysis: collect data over a fixed period, subtotal by category, rank in descending order, then compute cumulative percentages.
- Define the problem or the result. Be specific. “Profit leakage” is vague. “Cost of rework on the Midwest plant’s top three product lines in the last two quarters” is workable.
- Choose the measure. Frequency, dollars, hours or margin. Decide before you look at the data, and see the pitfalls section below before you default to counting.
- Collect data for a fixed period. Use a window long enough to smooth out one-off spikes, such as two to four quarters, and use the same window for every category.
- Group and subtotal. Sort records into categories. Keep the list manageable. If “other” is your biggest bar, your categories are too coarse.
- Rank from largest to smallest. Then compute each category’s share of the total and a running cumulative percentage. Per the Oregon State guidance, add each subtotal to the ones before it and divide by the grand total.
- Chart it. Draw bars in descending order with the cumulative line on a secondary axis. Current versions of Excel can build a Pareto chart for you, including the sorting and the cumulative line.
A worked example with numbers
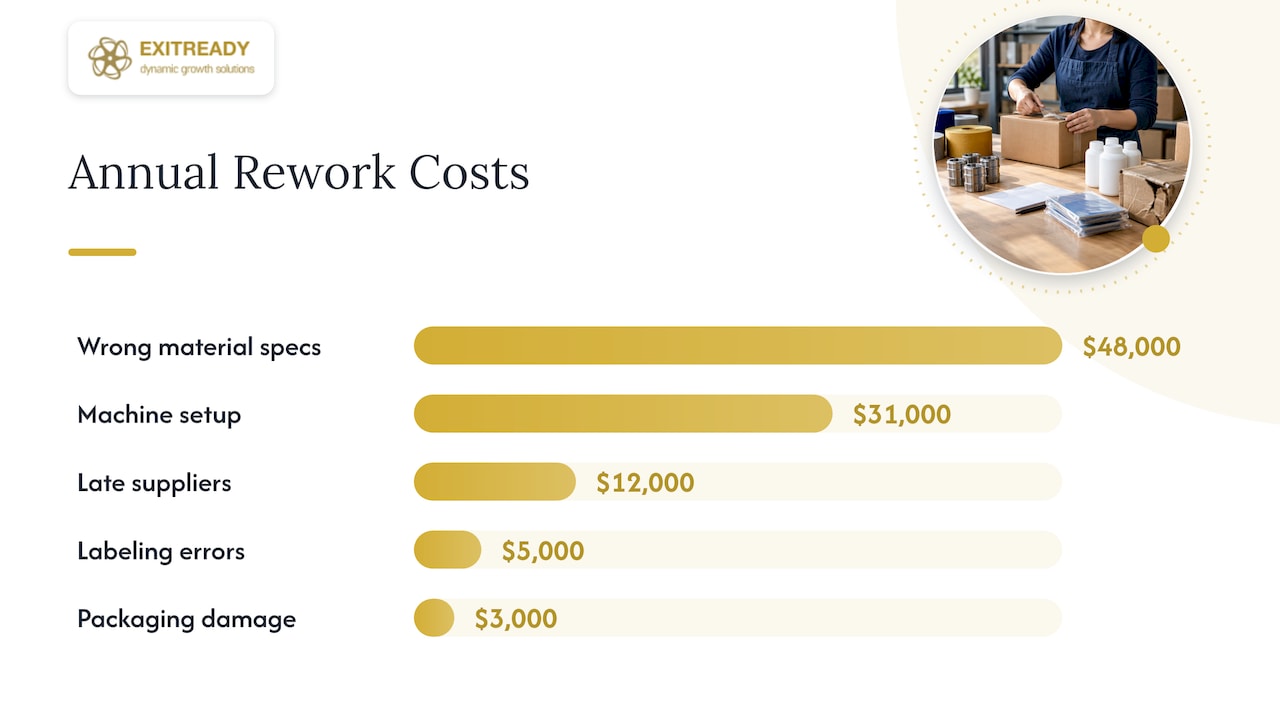
The figures below are illustrative, not client data. Imagine a manufacturer that spent $100,000 last year on rework and scrap, tracked by cause.
| Cause | Annual cost | Share of total | Cumulative share |
|---|---|---|---|
| Wrong material specification | $48,000 | 48% | 48% |
| Machine setup errors | $31,000 | 31% | 79% |
| Late supplier deliveries | $12,000 | 12% | 91% |
| Labeling errors | $5,000 | 5% | 96% |
| Packaging damage | $3,000 | 3% | 99% |
| Everything else | $1,000 | 1% | 100% |
Two of six causes account for 79% of the cost. Those two are the vital few. The owner now has a clear starting point: fix how material specs are communicated and standardize machine setup, before touching anything else.
Now the twist that makes this worth doing properly. Suppose labeling errors happen most often, say 120 times a year, while wrong material specs happen 15 times. A frequency chart would send the team after labels. The cost chart points at specs. Same data, opposite priorities.
How to read the chart
Look at the bar heights first. They show the primary drivers of the problem, whether measured in frequency, cost or time. Then look at the cumulative line. According to the Oregon State guidance, the point where that line reaches 80% marks the threshold of the vital few that account for most of the effect.
Three questions help you turn the picture into a decision:
- How steep is the curve? A steep drop after one or two bars means a concentrated problem and a quick win. A gentle slope means many small causes, and you probably need a process-level fix instead of a targeted one.
- Is the biggest bar controllable? A huge cost you cannot influence (a regulatory fee, a commodity price) is a fact to manage, not a project.
- What is the effort to fix each bar? The best first project is often not the tallest bar but the tallest bar you can fix in 60 days.
It is not always 80/20
Owners sometimes dismiss the method because their numbers do not split exactly 80/20. That misses the point. IMD’s business school describes the ratio as a rule of thumb, not a rigid mathematical law: patterns may show up as 70/30, 90/10 or another skewed split. The value lies in finding the leverage points, not forcing data into a ratio.
In data-rich environments the skew can be sharper still. An ASQ article on statistical methods notes that firms using advanced analytics often see much steeper distributions such as 10/90, 5/50 or even 1/25, where the vital few become the vital fewer. If your top 5% of customers produce half your profit, the principle still holds. The concentration is just more extreme, and so is the risk of depending on those accounts.
Five mistakes that make a Pareto chart misleading
Counting instead of costing
Frequency is the easiest thing to measure, so it is the usual default. But a low-frequency problem can carry a much higher financial penalty through scrap or rework. Oregon State’s guidance on quality control flags this pitfall directly and recommends integrating cost into the analysis rather than only counting occurrences. If you can only do one thing differently, do this.
Trusting intuition over validation
When analysts eyeball the cutoff, they can mislabel the vital few. The same ASQ article describes how modern practitioners use critical values and p-values to remove this subjectivity. For a first pass in a mid-sized company, a clear chart is enough. For a six-figure decision, ask someone to check whether the gap between bars is real or just noise.
Using a window that is too short
One bad month can crown the wrong cause. Use a long enough period, and check whether the ranking holds when you split the data in half.
Stopping at the chart
A Pareto chart shows where the problem sits, not why. Once you know the tallest bar, you still need root-cause work: process walks, interviews with the people doing the job, and a test of the fix. Then write down the new way of working. A fix that lives in one manager’s head disappears when that manager does. Our piece on standard work in mid-market manufacturing shows what documented, repeatable execution looks like in practice.
Running it once
After you fix the top cause, the second bar becomes the first. Rerun the analysis quarterly, or whenever the business changes materially: a new product line, a new plant, a new major customer.
When basic Pareto is not enough
The chart is a snapshot of the past. For customer analysis, some firms go further. Research on customer-base modeling describes the Pareto/NBD model, which estimates customer lifetime value and the probability that a customer is still active, rather than just ranking historical spend. The same research indicates that grouping customers first, by acquisition channel or cohort, improves predictive accuracy compared with applying one model to the whole database.
That is a step for companies with clean transaction data and an analyst who can maintain it. For most owners, the sequence is: run the basic version, fix the top one or two causes, and add sophistication only when the simple chart stops answering your questions.
The tool is also evolving. MIT’s Initiative on the Digital Economy has argued that AI may change how the 80/20 rule is applied, letting organizations segment far more finely than a single top-20% cut. The core habit stays the same: find where the leverage is, then concentrate effort there.
Our perspective: the vital few usually include the owner
When we work with mid-market owners, the Pareto pattern rarely stops at customers or defects. It shows up in how decisions get made. A small number of recurring decisions, approvals and exceptions tend to run through the owner’s desk, and they eat most of the week. That dependency is the most expensive bar on the chart, because it caps growth and it lowers what a buyer will pay for a company that cannot run without its founder.
This is why we begin with a diagnostic before selling any program. We would rather measure where value and effort are concentrated than hand you a generic template. Our operational assessment checklist and the 10-minute operational maturity diagnostic are built on that idea: find the few processes and decisions that matter most, document them as playbooks, and delegate them with clear standards.
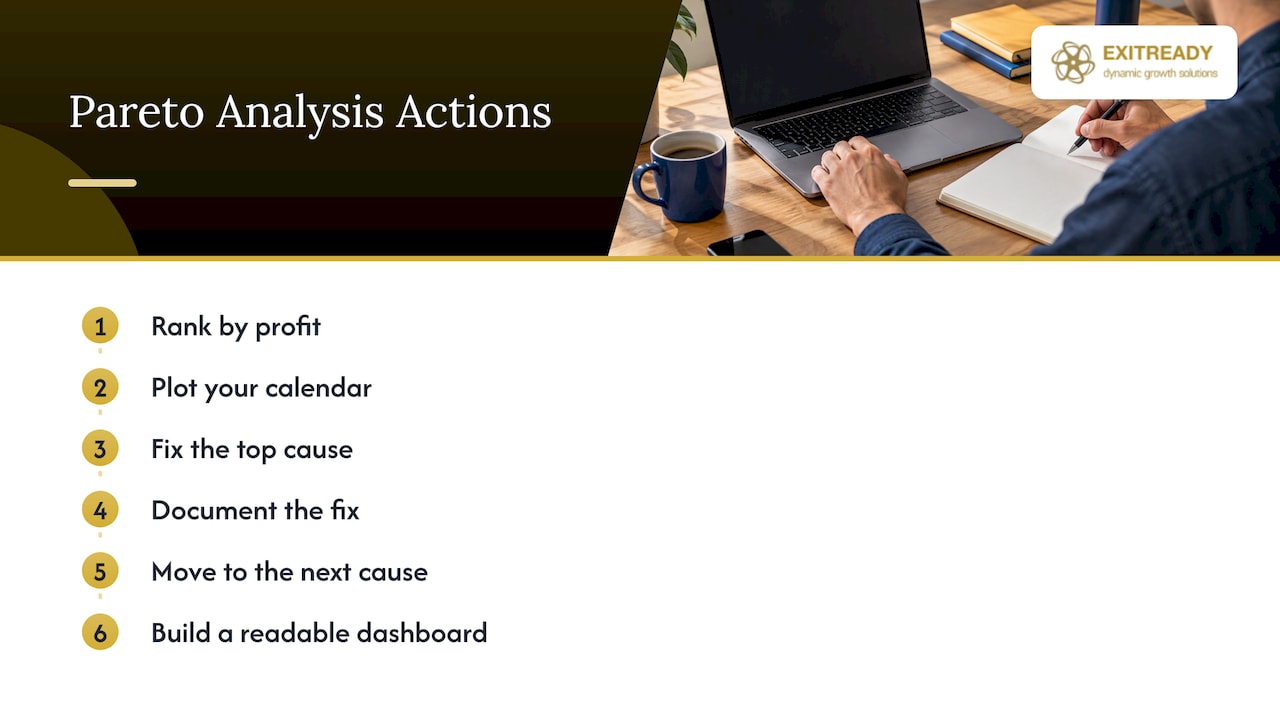
Our advice on the analysis itself is plain. Rank by profit, not volume. Put your own calendar on the chart. Fix the top cause, write it down, and move on to the next one. Then put the numbers on a dashboard your managers can read at a glance, as we describe in our guide to operating dashboard design.
— Andre
Turning the analysis into a result
If your chart points to profit leakage you cannot explain, or to processes that depend on you personally, an outside diagnostic can save months. Our 360-ProfitDriver analysis looks at where profit is made and lost across the business. For a defined, time-boxed project, our Growth Sprint and Performance Sprint programs are published at $7,500 to $10,000 and $15,000 to $20,000 respectively, as one-off engagements. If you would rather talk it through first, you can schedule a strategy call.
A simple 30-day plan
- Week 1: Pick one problem and one measure (dollars, ideally). Pull the data.
- Week 2: Build the table and chart. Check the ranking against a different time window.
- Week 3: Take the top one or two bars. Run a root-cause review with the people closest to the work.
- Week 4: Choose one fix, assign an owner, set a number to hit, and document the new procedure.
Then put a date on the calendar to rerun the chart. If you want a broader view of why this discipline pays off, see our note on why operational efficiency drives profit.
FAQ
How do you interpret a Pareto chart?
Read the bars from left to right: the tallest bars are the biggest drivers of the problem by frequency, cost or time. Then follow the cumulative percentage line to see where it reaches about 80%. The categories to the left of that point are your priorities.
How do you calculate a Pareto chart?
Collect data on one problem over a fixed period, subtotal each category, and sort them from largest to smallest. Compute each category’s share of the total, then add the shares cumulatively. Plot the subtotals as bars and the cumulative percentages as a line.
Does the 80/20 rule always apply?
No. It is a rule of thumb, and real data can come out at 70/30, 90/10 or steeper. What matters is that a small group of causes produces a disproportionate share of the result. Use your actual numbers rather than forcing them into a ratio.
Should I rank by frequency or by cost?
For business decisions, cost or profit impact is usually the better measure. Frequency can send you after common but cheap problems while an infrequent, expensive one goes untouched. If you have both, build two charts and compare them.
Sources
- ASQ: What is a Pareto chart?
- ASQ: 7 basic quality tools
- ASQ Quality Progress: Making the Cut
- Oregon State University Extension: Statistical Process Control, Part 3
- IMD: Pareto analysis
- WJARR: Effectiveness of applying the Pareto principle in optimizing business processes and expenses
- Wiley, Quality and Reliability Engineering International: Juran and the Pareto principle
- University of Pennsylvania: Customer-base analysis on a data diet
- MIT IDE: AI Is Going to Change the 80/20 Rule
- Pryor Learning: How to make a Pareto chart in Excel