

A KPI cascade is a structured line of sight that translates one to three strategic priorities into measurable indicators across three organizational tiers. The single best move is to pick those priorities now and pilot a cascade for one quarter rather than designing a perfect system up front. Success looks like named owners, clear targets, and metrics that connect the boardroom to daily work.
TL;DR:
- Cascades should be pilot tested for one quarter using clear, specific KPIs and ownership to identify practical issues before wider implementation.
- Most organizations benefit from a hybrid cascade model, with enterprise targets set top-down and unit-level metrics proposed bottom-up to reflect local conditions.
- Keep KPI trees to three or four levels deep and explicitly define cause-effect, companion, or conflict relationships to ensure clarity and actionability.
- Assign a dedicated owner, establish a regular review cadence, and validate data sources to maintain data integrity and accountability across all tiers.
- Focus on one strategic priority per pilot, locking in ownership and governance first, before attempting to scale the cascade across multiple themes.
Table of Contents
- What a KPI cascade is and why the three tiers matter
- Choosing a cascading model: top-down, bottom-up, or hybrid
- Building the KPI tree: structure, relationships, and documentation
- A step-by-step checklist to pilot a cascade this quarter
- Governance, ownership, and keeping the data honest
- Common mistakes and how to fix them quickly
- A minimal cascade example for a revenue growth priority
- How we apply KPI cascading inside AOS engagements
- A practical takeaway on where leaders go wrong
- Get help designing and piloting your own KPI cascade
- FAQ
- Sources
What a KPI cascade is and why the three tiers matter
A KPI cascade takes enterprise strategy and breaks it into objectives and measures that get more specific as they move down the organization. According to the Balanced Scorecard Institute’s Nine Steps to Success, this process spans three tiers:
- Tier 1 (enterprise): the handful of strategic KPIs the leadership team owns and reports to the board.
- Tier 2 (business or support unit): metrics each division or function controls that feed directly into Tier 1 results.
- Tier 3 (team and individual): the daily or weekly numbers frontline teams influence directly.
Cascading matters because it gives everyone a line of sight from their own work to the company’s priorities. Without it, departments track whatever is locally convenient, and leaders end up reconciling metrics that were never designed to connect in the first place.
Choosing a cascading model: top-down, bottom-up, or hybrid
The right model depends on how uniform your business units are. Top-down cascading works when units share the same market and operating model, since leadership can push the same KPI structure everywhere and move fast. Organizational guidance on top-down versus bottom-up approaches notes that bottom-up cascading suits heterogeneous units better, because it lets each team define metrics that reflect its own conditions and builds stronger buy-in.
- Top-down: fast to deploy, consistent across the company, but risks ignoring unit-level nuance.
- Bottom-up: stronger ownership and relevance, but slower and harder to roll up cleanly.
- Hybrid: enterprise sets the destination (Tier 1 targets), units propose how they will get there (Tier 2 and Tier 3 KPIs), with a governance step to resolve conflicts before anything goes live.
Most mid-market companies land on a hybrid approach once they have more than two or three distinct business lines.
Building the KPI tree: structure, relationships, and documentation
A KPI tree is the visual map that shows how lower-level measures roll up into higher-level ones. Practitioner guidance on KPI trees recommends keeping the structure to three or four levels deep. Beyond that, the tree becomes too abstract to act on and too fragile to maintain.
Three relationship types govern how KPIs connect, a distinction explored in Stacey Barr’s framework for aligning KPIs to strategy:
- Cause-effect: one metric drives another, such as outbound calls driving booked meetings.
- Companion: two metrics move together without one causing the other, useful for spotting early warning signs.
- Conflict: improving one metric can hurt another, such as discount rate versus average deal value, and these pairs need explicit trade-off rules.
Every KPI in the tree needs its own short specification: a plain-language definition, the exact formula, a named individual owner, the reporting frequency, the data source, and how it aggregates upward. Skipping this step is the single most common reason cascades fall apart within two quarters, since teams end up arguing about what a number means instead of acting on it.
A step-by-step checklist to pilot a cascade this quarter
Running a cascade as a quarter-long pilot, rather than a company-wide rollout, keeps the scope manageable and surfaces real problems early.
- Confirm one to three strategic priorities and define the Tier 1 KPIs that measure them directly, with explicit targets and timeframes.
- Design Tier 2 and Tier 3 KPIs for a single value stream, writing out the aggregation rule for each one and naming an individual owner, not just a department.
- Set targets and light automation, then run the pilot across that one value stream for six to twelve weeks before touching anything else.
- Establish the review cadence and governance structure, decide what gets escalated and when, then roll the cascade out more broadly or rework the parts that did not hold up.
Practitioner analysis of KPI cascading in operations finds that cascades often fail not because the concept is flawed, but because organizations skip the coordination and monitoring work between tiers. A short, well-governed pilot catches that gap before it spreads.
Pro Tip: Pilot on the value stream with the most reliable existing data, not the one with the biggest strategic headline, so early results reflect the cascade’s design rather than data gaps.
Governance, ownership, and keeping the data honest
A cascade is a governance mechanism as much as a measurement system. Each KPI needs one named individual accountable for it, a RACI structure clarifying who is consulted and informed, and an escalation trigger that fires before a miss becomes a surprise.
- Name one accountable owner per KPI, not a department, and record it in the KPI documentation.
- Set a review cadence: weekly dashboard checks for Tier 3, monthly deep-dives for Tier 1 and Tier 2.
- Validate the data pipeline by mapping each KPI to its source system and building in checks that catch manual entry errors before they reach a dashboard.
Case study research on cascading and alignment points to a recurring pattern: cascades that stick tend to have a corporate-level function, a strategic management office or equivalent, that reviews scorecards on a fixed schedule and enforces consequences for misalignment.
Common mistakes and how to fix them quickly
Three failure patterns show up again and again in cascade rollouts, and each has a fast fix.
- Overcomplication: too many KPIs at every tier dilutes focus. Cap Tier 1 at three to five KPIs and cap tree depth at four levels.
- Ownership gaps: metrics with no individual owner go stale within a month. Run a short RACI workshop before the pilot starts and name owners by name, not title.
- Conflicting KPIs: two metrics pulling in opposite directions create silent sabotage. Surface the trade-off explicitly and set a rule for which one wins when they clash.
A minimal cascade example for a revenue growth priority
Here is a compact cascade built around a single Tier 1 priority, revenue growth, to show how the tiers connect in practice.
- Tier 1: revenue growth rate, defined as year-over-year change in closed revenue, with a leadership-set target.
- Tier 2: sales unit conversion rate (qualified leads to closed deals) and average deal value, each owned by the sales unit leader.
- Tier 3: outbound calls per rep and individual win rate, owned by each sales rep, rolling up into the Tier 2 conversion rate and, from there, into Tier 1 revenue growth.
This same logic applies to cost, quality, or retention priorities. Our overview of business performance metrics walks through metric categories worth tracking beyond revenue.
How we apply KPI cascading inside AOS engagements
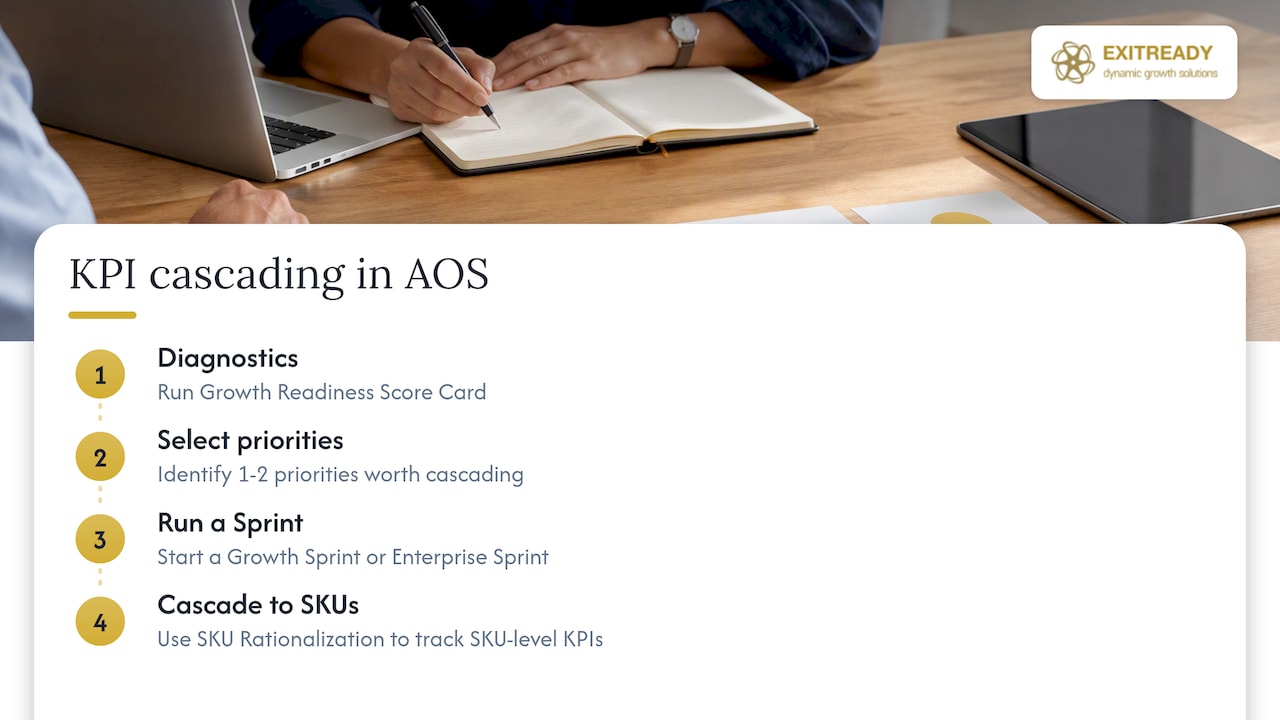
Business operating systems can build cascades as part of a broader move from owner-dependent operations to documented, self-sustaining ones. A Growth Sprint or Enterprise Sprint typically starts with diagnostics similar to our Growth Readiness Score Card to identify the one or two priorities worth cascading first. For product-heavy businesses, our SKU Rationalization Scorecard shows how an operational scorecard tracks execution KPIs at the SKU level, the same discipline a Tier 3 metric needs.
A practical takeaway on where leaders go wrong
Pick one strategic theme, pilot it for a single quarter, and lock down ownership before you scale anything. Chasing a bigger dashboard before governance is solid just adds noise.
— Andre
Get help designing and piloting your own KPI cascade
If reading this confirmed you have the concepts but not the bandwidth to build and govern a cascade internally, that is exactly where our AOS Enterprise Assessment and Value Creation Partnership come in. We start with a diagnostic, not a template, so the Tier 1 priorities and the cascade structure reflect your actual business rather than a generic framework.

- A Growth Sprint or Performance Sprint builds the cascade and pilots it with your team inside a fixed engagement window.
- Our Growth Readiness Score Card gives you a starting diagnostic before you commit to a full program.
- For leaders who want the alignment work done alongside operational execution, our leadership alignment workshop sets up the governance a cascade needs to survive past quarter one.
If you want a structured next step, schedule a strategy call and we will walk through where a cascade fits in your current operating model.
FAQ
What is cascading KPI?
Cascading a KPI means breaking a high-level strategic measure into more specific indicators at each organizational tier, so enterprise, unit, and team metrics all connect back to the same priority. The Balanced Scorecard Institute’s Nine Steps framework describes this as building an enterprise scorecard first, then cascading objectives and measures downward with documented ownership.
What are the 5 key performance indicators?
There is no universal list of five KPIs that applies to every business, since the right indicators depend on your strategic priorities and industry. A useful starting point is to define three to five Tier 1 KPIs tied directly to your current strategic themes, then cascade those into unit and team-level measures.
What are the 4 KPIs every manager has to use?
There is no fixed set of four KPIs that applies across every management role, and treating the question that way tends to produce generic, disconnected metrics. A more reliable approach is to define a manager’s KPIs from the Tier 2 or Tier 3 objectives that roll up into their unit’s strategic priorities.
What are the top 3 KPIs?
The top three KPIs for any organization are the ones tied to its one to three current strategic priorities, which is why they differ from company to company. Capping Tier 1 at three to five KPIs keeps leadership focused and makes the cascade into lower tiers easier to manage, as recommended in practitioner guidance on KPI trees.
How often should a KPI cascade be reviewed and updated?
A practical cadence is weekly dashboard reviews for Tier 3 metrics and monthly deep-dives for Tier 2 and Tier 1, with a full cascade reassessment whenever strategic priorities shift. Practitioner analysis of cascading in operations ties successful cascades to sustained monitoring rather than a one-time setup.
Sources
- Balanced Scorecard Institute — Nine Steps to Success
- Unlock operational excellence with KPI cascading — Food Industry Executive