

If one customer generates more than 20% of your trailing 12-month revenue, or your top five customers exceed 25% to 40% combined, you have material customer concentration risk. The fix starts today: pull trailing-12-month revenue by customer, calculate the concentration ratio, and run a sensitivity check on what losing your biggest account does to cash and EBITDA before a buyer, lender, or bad month forces the question.
TL;DR:
- A single customer generating more than 20% of revenue or the top five accounts exceeding 25% to 40% combined signals material concentration risk requiring urgent mitigation.
- Calculations using the Herfindahl-Hirschman Index and sensitivity modeling show that losing a high-margin, profit-peak customer can reduce EBITDA more than revenue loss suggests.
- High concentration affects cash flow timing, bargaining power, and deal valuation, with potential risks including payroll issues, margin compression, and deal delays.
- Structuring a mitigation plan should prioritize early actions like tightening receivable terms and diversifying into new markets within the first 180 days.
- Continuous monitoring with a concentration dashboard, ownership assignments, and escalation triggers enables early detection and action against rising customer dependency.
Table of Contents
- What Customer Concentration Risk Actually Means
- How Do You Calculate Customer Concentration Risk?
- The Real Business Cost of Relying on Too Few Customers
- A Mitigation Playbook by Timeline
- Building a Monitoring System That Catches Risk Early
- Turning Measurement Into Protection
- The Blind Spot Most Owners Miss
- Get a Clear Read on Your Concentration Exposure
- Sources
- FAQ
What Customer Concentration Risk Actually Means
Customer concentration risk is the exposure a business carries when a small number of customers generate a disproportionate share of its revenue or profit. Lose one of those accounts, and the business doesn’t just shrink. It can miss payroll, trip loan covenants, or stall a sale.
Revenue share alone tells an incomplete story. That’s why a profit heat map, built from transaction-level profitability rather than top-line billing, gives a sharper read. Harvard Business Review’s research on profit-based risk found that roughly 20% of customers can generate about 150% of total profits, meaning other accounts are actively draining margin. Losing a “profit peak” customer hurts far more than losing a high-revenue, low-margin one.
Context changes the interpretation of any percentage:
- Industry norms differ (a 30% share is normal in aerospace supply chains, alarming in retail)
- Contract length and renewal terms matter more than raw dollar volume
- Who owns the relationship internally determines how fast that revenue could walk out the door
How Do You Calculate Customer Concentration Risk?
Three formulas cover most of what you need. The single-customer percentage is that customer’s trailing-12-month (TTM) revenue divided by total TTM revenue. The top-N share sums the largest N customers’ revenue over the same total. The Herfindahl-Hirschman Index (HHI) squares each customer’s percentage share and sums the results, producing a single score that reflects how lopsided the whole customer base is, not just the top account.
Before you calculate anything, gather three data sets, according to Wall Street Prep’s concentration framework: TTM revenue by customer, each customer’s contribution to gross profit, and accounts receivable aging by customer.
Here’s a worked example for a $10 million revenue business:
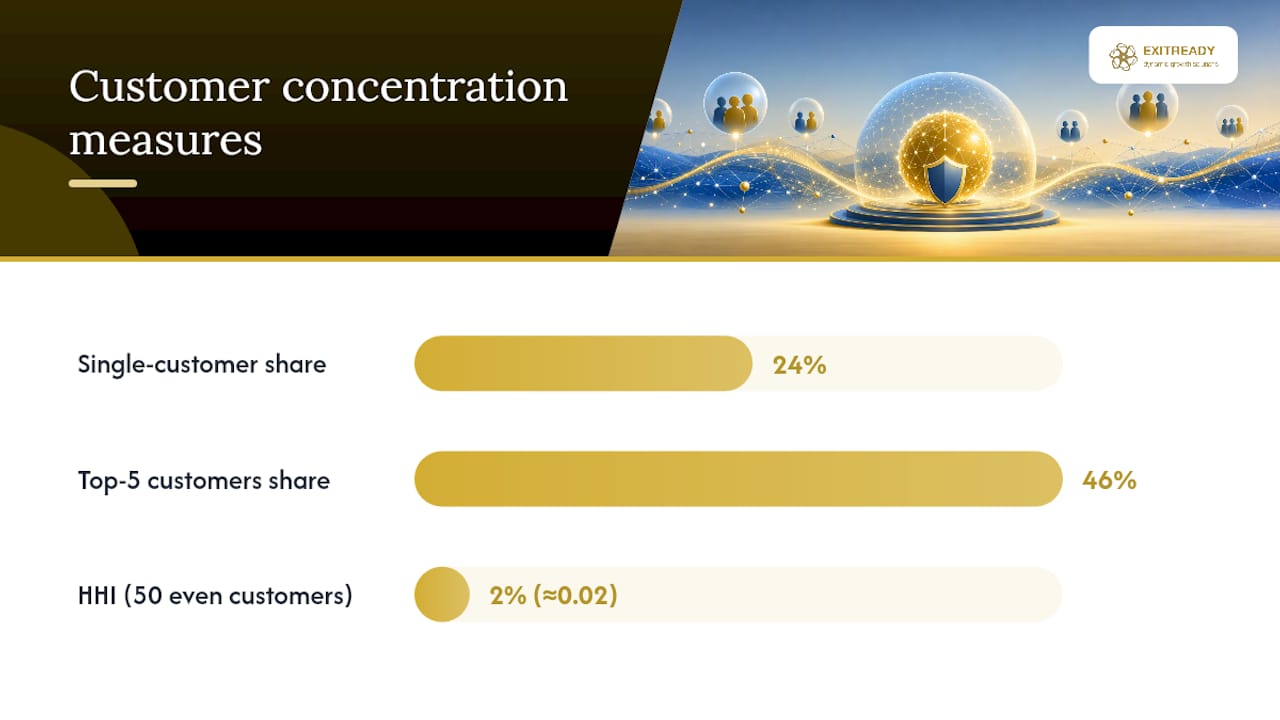
- Customer A bills $2.4 million (24% of revenue), Customer B bills $1.3 million (13%), and the remaining 47 customers split the rest.
- Single-customer percentage for Customer A: 24%. That alone clears the attention threshold.
- Top-5 share: add the five largest accounts. Say they total $4.6 million, or 46% of revenue.
- HHI: square each customer’s share (as a decimal) and sum them. A base of 50 evenly split customers yields an HHI near 0.02. Concentrated bases with one dominant account push well past 0.10, signaling real fragility.
- Sensitivity check: model Customer A’s abrupt loss. If Customer A carries 30% gross margin against a company-wide 40% average, losing that account could cut EBITDA by more than the 24% revenue drop suggests, because fixed costs don’t shrink with it.
Rule-of-thumb thresholds: Under 15% single-customer share is generally low risk. Between 20% and 40% is a range that demands active monitoring, and above 40% is widely treated as severe vulnerability for small and mid-market firms.
The Real Business Cost of Relying on Too Few Customers
Concentration doesn’t just threaten future revenue. It reshapes cash flow, leverage, and how the market values your business right now.
- Cash flow timing: A concentrated customer that runs 60 or 90-day payment terms, or slips into 120, can freeze payroll and vendor payments even when the income statement looks healthy.
- Bargaining power erosion: Customers who know they represent a large share of your book tend to push for discounts, extended terms, or exclusivity clauses. Margins compress quietly, year over year.
- Deal-structure consequences: In M&A or financing, buyers and lenders routinely apply valuation discounts, structure earnouts, or demand holdbacks when concentration is high, according to Wall Street Prep’s due-diligence analysis. Some deals require the seller to stay on and personally manage the relationship through a transition period.
Regulators treat this as more than a private-company nuisance. The OCC’s Comptroller’s Handbook on Concentrations instructs examiners to treat concentrated exposures as a threat to earnings and capital even when each individual transaction looks sound on its own. That standard, built for banks, applies just as directly to a company whose survival depends on one buyer renewing a contract.
A Mitigation Playbook by Timeline
Fixing concentration risk isn’t a single project. It’s a sequence, and the order matters because some moves buy you time while others buy you structural safety.
- Days 1 to 30: Tighten accounts receivable terms with your largest customers, run a cash runway stress test assuming a 90-day payment gap, set an internal alert for any customer crossing 25% of revenue, and have an honest conversation with your largest account about contract renewal and scope.
- Days 30 to 180: Convert project-based work into recurring contracts wherever the relationship supports it, revisit pricing on low-margin concentrated accounts, open a second sales channel or vertical, and bring in a fractional CFO if nobody owns cash forecasting full-time.
- Beyond 180 days: Expand into adjacent products or markets that don’t depend on the same buyer type, document account playbooks so no single salesperson is irreplaceable, build succession for the person who owns your largest relationship, and formalize board-level review of concentration metrics.
Assign one name to each action item, with a deadline and a number attached (percentage reduction, days of runway added), not a vague ownership label.
Pro Tip: Don’t wait for a renewal conversation to find out how replaceable you are to your biggest customer. Ask directly what percentage of their spend you represent. If you don’t know your share of their budget, you’re negotiating blind.
Building a Monitoring System That Catches Risk Early
A concentration dashboard only works if someone actually looks at it on a schedule, which often requires expert AI strategy and security consulting to implement effective automation and analytics. Track five numbers monthly: largest customer as a percentage of TTM revenue, top-5 share, HHI score, payment timing variance versus stated terms, and a simple client health score based on order frequency and support tickets.
Set escalation triggers before you need them, not during a crisis. A workable rule, drawn from CFO-side frameworks, is to flag any single customer exceeding 25% of revenue or gaining 5 percentage points in a single quarter. Pair every trigger with a pre-agreed action, so the response doesn’t get debated mid-emergency.
Governance works best with clear ownership:
- Finance owns the monthly calculation and dashboard update
- The sales or revenue lead owns relationship health and renewal timing
- The board or ownership group reviews concentration metrics quarterly, not annually
This cadence mirrors what the Federal Reserve’s interagency guidance on concentration risk and NCUA’s concentration risk guidance both require of regulated institutions: documented limits, defined monitoring frequency, and contingency plans that exist before the exposure becomes a crisis.
Turning Measurement Into Protection
Running the numbers is only half the job. The other half is converting that data into decisions about which customers to protect, renegotiate, or walk away from.
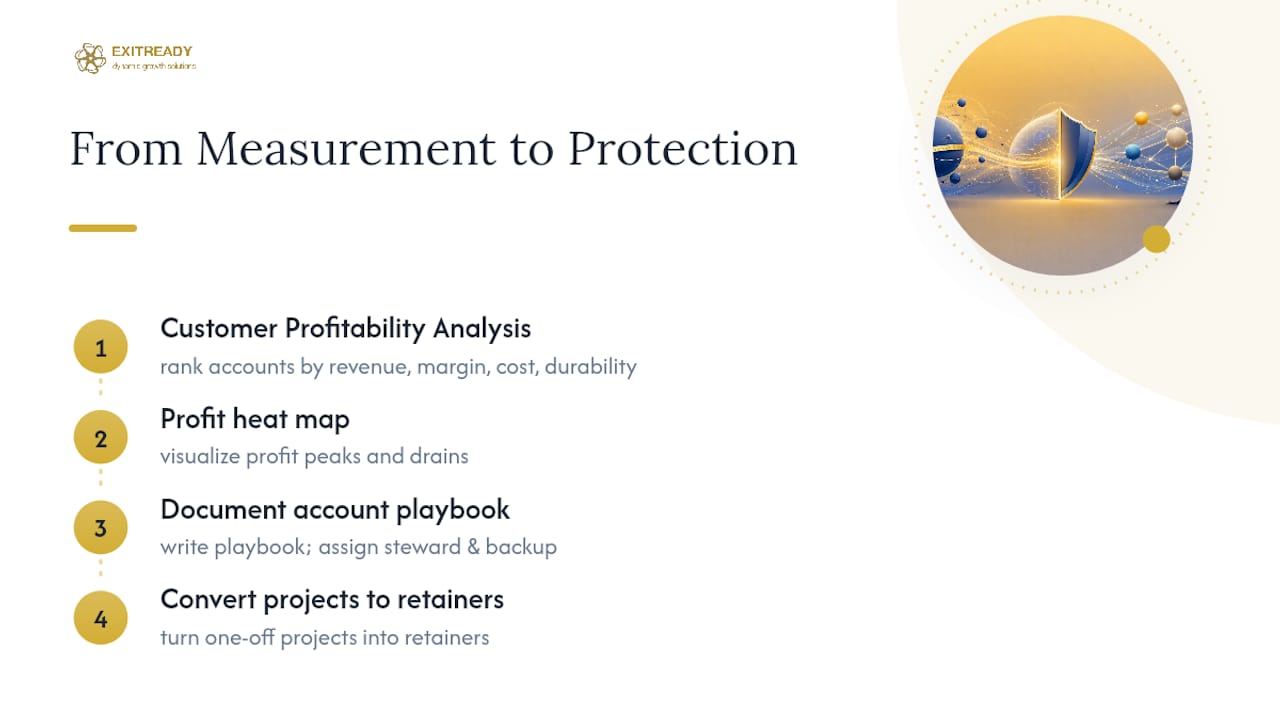
A Customer Profitability Analysis takes revenue share, gross margin, cost-to-serve, and relationship durability and ranks every major account by actual risk and opportunity, not just billing size. That ranking is what a profit heat map is built for. Once you know which accounts are profit peaks worth protecting and which are quietly draining margin, the next step is operational: document the account playbook, assign a steward and a backup owner to every concentrated relationship, and convert one-off project work into retainer agreements where the customer relationship supports it. This is the sequence applied through a diagnostic-first process, moving from assessment to a documented playbook to implementation.
The Blind Spot Most Owners Miss
The real danger with customer concentration risk usually isn’t the percentage on the spreadsheet. It’s the back office quietly built around one customer’s habits: billing cycles timed to their approval process, collections handled informally because “they always pay eventually,” forecasting that assumes their volume never changes. That structural fragility doesn’t show up until a payment gets delayed 45 days and suddenly nothing else in the business was built to absorb it.
If you do one thing this week, pull trailing-12-month revenue by customer and run the concentration ratio plus a basic loss scenario. You’ll know within an hour whether you’re managing a business or managing one relationship that happens to write invoices.
— Andre
Get a Clear Read on Your Concentration Exposure
Dynamicgrowthsolutions built its approach around one difference from a typical consulting engagement: nothing gets sold until a rigorous diagnostic identifies exactly where your revenue risk sits, customer by customer, using Fortune 500-caliber analysis adapted for mid-market companies.

The ProfitDriver Analysis™ maps your customer base by profit contribution, not just revenue, and surfaces which accounts are worth protecting, repricing, or replacing. Owners carrying heavy concentration in one or two accounts, especially those eyeing a sale or a growth raise in the next few years, benefit most, since buyers and lenders scrutinize this exact metric during due diligence. From there, the Enterprise Assessment and AOS Value Creation Partnership turn the findings into documented playbooks and delegation systems that reduce dependency on any single relationship, whether that’s a customer or the owner. If you’re ready to see where your exposure actually sits, start with the assessment and get a concrete plan instead of a guess.
Sources
- How to calculate risk based on where your profits come from — Harvard Business Review
- Concentrations — Comptroller’s Handbook (OCC)
- Customer Concentration — Wall Street Prep
FAQ
What Is an Example of Concentration Risk?
A manufacturer where one distributor accounts for 35% of annual revenue is a textbook example. If that distributor switches suppliers or renegotiates pricing, the manufacturer’s cash flow and margin take an immediate, outsized hit rather than a gradual one.
What Does Concentration Risk Mean in Simple Terms?
It means too much of your revenue, profit, or cash flow depends on too few customers. The narrower that base, the more a single lost account or delayed payment can threaten operations, and the more scrutiny it draws from buyers or lenders during due diligence.
What Do You Mean by Customer Concentration?
Customer concentration describes how revenue or profit is distributed across a company’s customer base. Businesses measure it using the single-customer percentage, top-N share, or Herfindahl-Hirschman Index, then compare results against rule-of-thumb thresholds like the 20% to 40% attention range.
How Do I Know if My Concentration Risk Is High Enough to Act On?
If one customer exceeds roughly 20% to 25% of trailing-12-month revenue, or your top five customers combine for more than 40%, that’s generally considered a level requiring active mitigation, not just monitoring. A Customer Profitability Analysis can confirm whether the risk is worse than revenue share alone suggests, based on margin and contract terms.