
For decision-grade costing, favor departmental or driver-based allocation over the revenue-based defaults most mid-market companies fall into by accident. Reserve full activity-based costing or time-driven ABC for cases where overhead runs above 30% of total cost or products consume resources in wildly different ways. Get the method right and pricing, product profitability, and capacity decisions all become clearer. The rest of this guide gives you the rules and the phased path to get there.
TL;DR:
- Overhead should be allocated by departmental or driver-based methods when overhead exceeds 30% of total costs or product resource consumption varies widely.
- Using a single-rate or revenue-based allocation distorts profitability insights, especially if overhead share is above 20% or product complexity differs significantly.
- Start with a quick overhead-share calculation and examine cost diversity to determine if departmental, ABC, or TDABC methods are appropriate.
- A phased rollout involving diagnosis, driver identification, testing, and governance ensures long-term accuracy and trust in the allocation model.
- Embedding allocation rules into documented processes and regular reviews prevents model staleness and supports ongoing decision-making clarity.
Table of Contents
- What Overhead Allocation Means for Pricing and Strategy
- Single-Rate, Departmental, ABC, or TDABC: What Fits Your Business
- Which Allocation Method Actually Fits Your Numbers?
- How to Roll Out Overhead Allocation in Four Phases
- Where Allocation Models Break Down and How to Prevent It
- A Worked Example: Single-Rate vs. Driver-Based Allocation
- Turning Allocation Into a Governed, Recurring Discipline
- Overhead Data Is Operating Data, Not Just Accounting Output
- Get Allocation Embedded, Not Just Calculated
- Sources
- FAQ
What Overhead Allocation Means for Pricing and Strategy
Overhead allocation is the process of spreading indirect costs, the ones you can’t trace directly to a single product or job, across the products, customers, or departments that actually consume them. Direct costs are easy: the steel in a part, the hourly wage of the technician who built it. Overhead is everything else: rent, IT support, HR, the CFO’s salary, the shared warehouse. Cost allocation distributes those shared costs using a reasonable basis, and the basis you pick changes the answer more than most owners expect.
Most mid-market companies group indirect spending into a handful of cost pools, each with its own natural driver:
- Facilities: allocated by square footage occupied
- IT and shared services: allocated by headcount or seat count
- HR and administration: allocated by headcount or payroll dollars
- Customer support: allocated by ticket volume or support hours
- Corporate overhead: allocated by revenue, headcount, or a blended driver
Get this wrong and it doesn’t just distort your accounting. It distorts the decisions built on top of it. Pricing a service line without knowing its true support burden means you can win a deal and lose money on it for years. Product and customer profitability reports built on lazy allocation tell you to double down on the wrong accounts. Budgeting and capacity planning both assume overhead scales predictably with volume, which it usually doesn’t. And under most accounting frameworks, factory overhead allocation directly affects how inventory gets valued on the balance sheet, so the stakes go beyond internal reporting.
Single-Rate, Departmental, ABC, or TDABC: What Fits Your Business
Every allocation method makes a trade between simplicity and accuracy. The question isn’t which method is “best.” It’s which distortion you can live with.
Single-rate (plantwide) allocation spreads all overhead using one driver, often direct labor hours or machine hours. It’s fast to build and easy to explain to a board. It works fine when overhead is a small slice of total cost and your products or services consume resources in roughly similar proportions. It falls apart the moment one product line eats far more support time than another and gets charged the same rate anyway.
Departmental rates split overhead by department first, then allocate within each department using a driver suited to that department’s actual resource consumption. This is often the single biggest accuracy jump for the least effort, since most mid-market firms already have department-level cost centers sitting in the general ledger, just unused for this purpose.
Activity-based costing (ABC) traces overhead to specific activities, then assigns activity costs to products or customers based on how much of each activity they actually consume. Moving from a traditional plantwide rate to ABC improves cost accuracy by an estimated 15 to 25% according to industry analyses, but it demands more data collection and ongoing maintenance.
Time-driven ABC (TDABC) simplifies ABC by using time estimates per unit of activity instead of building a full activity dictionary. It’s a strong fit when timing data already exists in a system like a ticketing tool or a scheduling platform.
Revenue-based allocation deserves a specific warning. It’s the most common default in mid-market finance because revenue is always available and never contested, but it systematically favors high-revenue, low-support customers over lower-revenue accounts that actually consume more overhead, quietly rewarding the wrong customer mix.
| Method | Accuracy | Setup effort | Best fit |
|---|---|---|---|
| Single-rate | Low | Minimal | Low overhead share, similar products |
| Departmental | Moderate | Low to moderate | Departments with distinct resource use |
| ABC | High | Significant | High overhead, diverse products |
| TDABC | High | Moderate (if time data exists) | Activity timing varies by job or ticket |
Which Allocation Method Actually Fits Your Numbers?
You don’t need a consultant to pick a method. You need three or four numbers and a bit of honesty about your data.
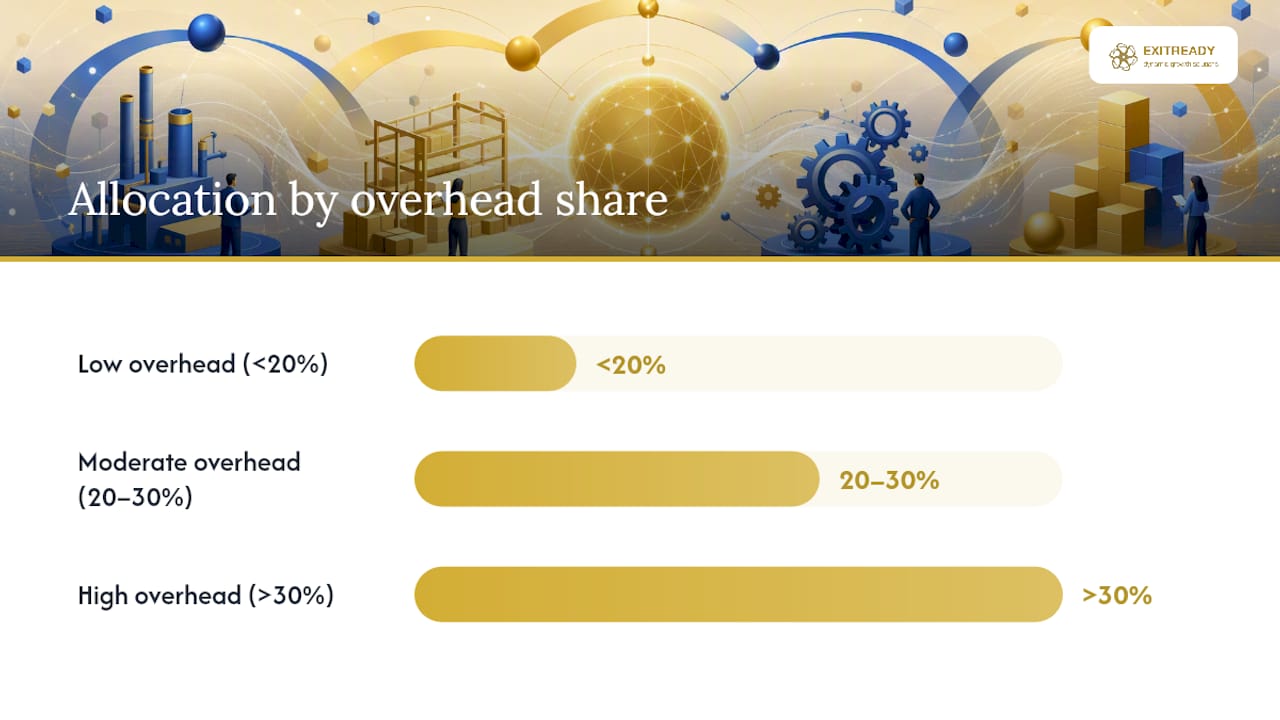
- Calculate your overhead share. Divide total indirect costs by total costs. Below roughly 20%, a single-rate approach is often defensible, since even a clumsy allocation won’t move your margins much.
- Check product or service diversity. If every job looks roughly the same in resource consumption, stick with something simple. If one line demands ten times the engineering hours of another, a flat rate will lie to you.
- Weigh overhead share against 20 to 30%. In that band, departmental allocation usually earns its keep without demanding a data overhaul.
- Push past 30% overhead, or high diversity, and ABC or TDABC becomes worth the investment. When overhead exceeds roughly 30% of total cost and consumption patterns vary widely, plantwide rates distort profitability enough that the extra data work pays for itself.
- Confirm you have the finance capacity to maintain it. ABC that nobody updates after quarter one is worse than a simple method run consistently.
Pro Tip: Run the overhead-share calculation before you touch method design. It takes ten minutes and it settles half the argument about which approach you need.
Set a review cadence once you’ve picked a method: allocations post monthly, but the methodology itself, the drivers, the pools, the rates, only needs a full review once a year unless the business changes shape faster than that.
How to Roll Out Overhead Allocation in Four Phases
Mid-market finance teams don’t need a system overhaul to get decision-grade allocation running. They need a scoped rollout that starts small and earns trust before it scales.
- Diagnose. Calculate total overhead as a percentage of total cost, then rank your cost pools by size. Most of the distortion risk sits in your three to five largest pools, so start there instead of trying to allocate everything at once.
- Identify drivers. For each priority pool, pick a driver that reflects actual consumption, and figure out where that data actually lives. Headcount often sits in your HRIS, ticket volume in your ITSM tool, square footage with facilities, and account activity in the CRM.
- Build and test. Build a spreadsheet proof of concept before buying any software. Reconcile the allocated totals back to the general ledger, then spot-check two or three known cases, a customer you know is expensive to serve, a product you suspect is underpriced, to see if the model agrees with what you already know.
- Embed and govern. Document the rules in a shared config, not a buried tab in someone’s spreadsheet. Schedule monthly posting with a driver snapshot saved alongside each run, and put a full methodology review on the calendar annually.
Two roles need to own this from day one:
- A finance owner who runs the monthly posting and reconciliation
- An operations sponsor who validates that the drivers still reflect how the business actually works
Coursework on cost allocation and profitability analysis covers the service-department redistribution mechanics this phase relies on, if your team needs a structured refresher before building the first model.
Where Allocation Models Break Down and How to Prevent It
The most common failure isn’t picking the wrong method. It’s letting a good method rot into an untrustworthy one.
Spreadsheet opaqueness tops the list. A model that only one analyst understands isn’t a model, it’s a liability with a due date. Driver data sitting outside the general ledger causes version drift, since headcount in the HRIS on posting day rarely matches what someone pulled three weeks earlier for budgeting. Numeric’s research on expense allocation points to this exact gap as the reason so many allocation models quietly go stale. Posting without a trace back to source data means nobody can defend the numbers when a product manager pushes back on their margin. And overengineering with a full ABC build for a company with 12% overhead wastes finance capacity that should go elsewhere.
Governance fixes are straightforward:
- Capture allocation rules in a shared configuration file, not a personal spreadsheet
- Save a driver snapshot every time you post, so you can reconstruct any month’s numbers later
- Reconcile allocated totals back to the general ledger every cycle, no exceptions
- Keep a trace from each allocated entry back to its source invoice or extract
Pro Tip: Before you roll out a new allocation methodology to department heads, walk one of them through a worked example on their own numbers. A model that survives contact with a skeptical operations manager will survive board scrutiny too.
Operational dashboards that surface cost drivers alongside financial results, like the ones covered in this guide to operational dashboards for business leaders, make it far easier to catch drift before it reaches a monthly close.
A Worked Example: Single-Rate vs. Driver-Based Allocation
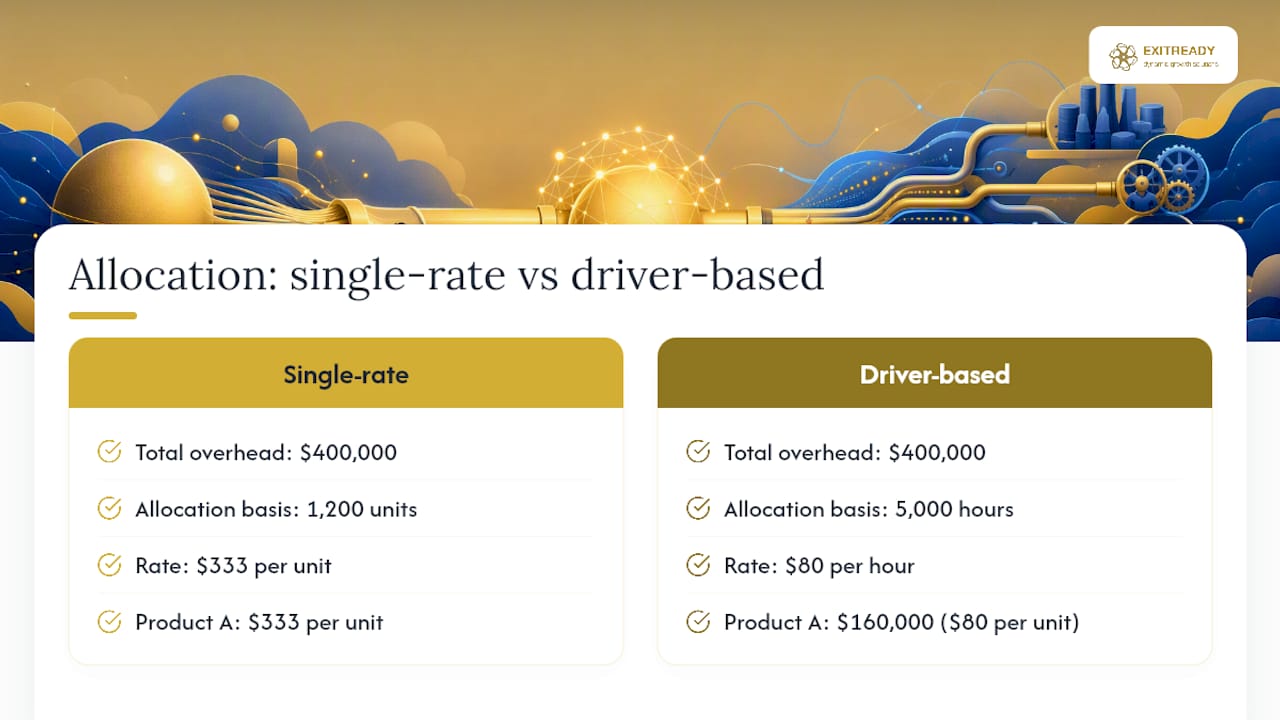
Take a company with $400,000 in monthly overhead and two products. Product A sells 1,000 units at $50 each with $30 in direct cost per unit. Product B sells 200 units at $200 each with $90 in direct cost per unit, but B consumes far more engineering and support time per unit than A does.
Under a single-rate method allocating overhead by unit volume, overhead per unit is $400,000 divided by 1,200 total units, or about $333 per unit, applied evenly regardless of actual consumption.
Under a driver-based method using engineering and support hours, suppose Product A consumes 2,000 hours and Product B consumes 3,000 hours out of 5,000 total. Overhead per hour is $80. Product A absorbs $160,000 ($80 per unit), while Product B absorbs $240,000 ($1,200 per unit).
The single-rate view makes both products look similarly unprofitable. The driver-based view shows Product A is close to breakeven while Product B is losing more than $1,000 per unit, a decision-relevant gap the flat rate completely hides. That’s the kind of finding that should trigger a repricing conversation or a hard look at cost-to-serve dynamics for the account mix behind Product B. Scaling this to ten or twenty products just means repeating the same driver logic across more activity pools.
Turning Allocation Into a Governed, Recurring Discipline
Getting the math right once doesn’t help if nobody keeps it current. The bigger challenge for most mid-market teams is turning a one-time allocation exercise into something that survives staff turnover, new product launches, and a CFO who eventually moves on.
Documented rules, a fixed monthly cadence, and clear decision rights are what keep an allocation model trusted a year after it’s built. That’s the same operating logic behind Dynamicgrowthsolutions’ AOS operating system, which replaces one-off spreadsheet fixes with playbooks that outlive any single owner or analyst. The Strategic Finance program applies the same thinking to cash flow forecasting and monthly financial cadence.
What this looks like in practice for allocation specifically:
- Written methodology docs instead of tribal knowledge locked in one analyst’s head
- A monthly posting cadence with saved driver snapshots for auditability
- Named decision rights so allocation changes go through a defined owner, not ad hoc edits
An initial assessment typically surfaces which of your cost pools carry the most decision risk, giving you a starting point before you build anything.
Overhead Data Is Operating Data, Not Just Accounting Output
If you’re only looking at allocated overhead once a year during budget season, you’re using it wrong. I’ve come to see allocation less as an accounting exercise and more as an early-warning system: the month a customer’s true support cost creeps past what you’re charging them is the month you need to know, not the month your auditor flags it.
The single most useful thing a mid-market finance leader can do this month is run the overhead-share diagnostic and name the top three cost pools driving distortion. In most implementations, that alone reveals at least one pricing decision that’s been quietly wrong for longer than anyone realized.
Get Allocation Embedded, Not Just Calculated
A one-time spreadsheet model tells you what your costs looked like last quarter. It doesn’t tell you whether anyone will still trust it, or update it, six months from now. That’s the gap Dynamicgrowthsolutions’ Strategic Finance program is built to close: instead of a consultant handing you a model and leaving, it works alongside your finance owner to document allocation rules, set a monthly posting cadence, and assign the decision rights that keep the numbers current.

The program pairs with the broader AOS framework, so allocation governance doesn’t sit in isolation from pricing, budgeting, or the exit-readiness work many mid-market owners are already thinking about. If your overhead model hasn’t been reviewed in the last year, or was never built with a driver data trail in the first place, start with a Strategic Finance assessment to see which cost pools carry the most decision risk right now.
Sources
For conceptual grounding, start with NetSuite’s overview of cost allocation and AccountingTools’ method breakdown. For implementation detail and driver-based accuracy gains, see the driver-based allocation guide and FEMA’s direct versus indirect cost guidance.
- Overhead Allocation Methods — From Revenue-Based Defaults to Driver-Based Accuracy
- What Is Cost Allocation? Definition, Methods, and Benefits | NetSuite
- Analyze cost allocation and profitability for decision making (Coursera)
- Cost allocation methods — AccountingTools
FAQ
What does “overhead allocation” mean?
Overhead allocation is the process of assigning shared, indirect costs, like rent, IT, and administration, to the products, customers, or departments that consume them, using a driver such as headcount or square footage.
How do you calculate overhead allocation?
Divide the total overhead in a cost pool by the total amount of the chosen driver (labor hours, machine hours, headcount) to get a rate, then multiply that rate by each product’s or department’s driver consumption.
What are the three main types of cost allocation?
The core approaches are single-rate (plantwide) allocation, departmental allocation, and activity-based costing, with time-driven ABC as a data-lighter variant of the third.
What is a good overhead cost percentage?
There’s no universal target, but overhead below roughly 20% of total cost usually tolerates a simple single-rate method, while overhead above 30%, especially with diverse products, typically calls for departmental or ABC-level precision.