
A working capital peg is the negotiated net working capital target that determines a dollar-for-dollar purchase-price true-up at closing. If actual working capital lands below the peg, the seller’s proceeds shrink by that exact shortfall; if it lands above, the buyer pays more. Most disputes trace back to how that number gets defined and measured, not the concept itself.
TL;DR:
- Normalizing working capital figures before negotiations reduces the risk of disagreements and can shift the peg by 3 to 15 percent of the purchase price.
- The most common calculation approach is a trailing 12- or 6-month average, which smooths seasonality and business cycle swings, but the choice can impact the true-up outcome.
- A detailed, line-by-line exhibit of included and excluded accounts is essential to prevent disputes over margins such as doubtful receivables or obsolete inventory.
- Implementing collar thresholds and caps in the SPA can effectively limit the financial impact of minor variances and downside exposure from working capital true-ups.
- Proper financial discipline, documented monthly closes, and early preparation can give sellers leverage and drastically reduce the likelihood of protracted true-up negotiations at closing.
Table of Contents
- What Counts in a Working Capital Peg (and What Doesn’t)
- How the Peg Gets Calculated: Methods, Normalization, and a Worked Example
- Timing, the True-Up, and What Happens When Numbers Don’t Match
- Negotiation Levers That Protect Both Sides of the Table
- A Preparation Checklist Before You Sign the LOI
- Why Documented Financial Discipline Wins Peg Negotiations
- The Peg Fight Nobody Prepares For
- Reduce Peg Risk Before You Ever Get to the Negotiating Table
- Sources
What Counts in a Working Capital Peg (and What Doesn’t)
The textbook definition of working capital, current assets minus current liabilities, is not what shows up in a purchase agreement. Deal-purpose net working capital (NWC) is a narrower, negotiated subset built to reflect the operating cash the business needs to run, stripped of financing and capital-structure noise.
In practice, the included accounts usually look like this:
- Accounts receivable, net of a reasonable bad-debt reserve
- Inventory, valued consistently with historical accounting methods
- Prepaid expenses tied to ongoing operations
- Accounts payable
- Accrued payroll, payroll taxes, and vacation liability
- Accrued income and sales taxes
Cash and interest-bearing debt are excluded on almost every deal, since those get settled separately through the purchase price and a cash-free, debt-free structure.
The real fights happen at the margins. Deferred revenue, restricted cash, aged or doubtful receivables, obsolete or slow-moving inventory, and owner-related accruals (bonuses, related-party payables) all get argued over because reasonable accountants can classify them differently. Working capital adjustments explains that small drafting differences on these line items can shift 3 to 15% of headline purchase price on a typical mid-market deal.
Statistic Callout: Working capital adjustments show up in more than 90% of private-target M&A transactions, according to SRS Acquiom’s study of over 1,200 deals worth more than $298 billion. This is not a rare contingency clause. It is standard deal mechanics.
The fix is unglamorous but effective: lock a line-by-line exhibit into the stock or asset purchase agreement (SPA) that names every included and excluded account, rather than relying on a one-sentence definition that both sides interpret differently six weeks after closing.
How the Peg Gets Calculated: Methods, Normalization, and a Worked Example
Three methodologies dominate mid-market deals, and the choice between them can swing the peg by real money.
- Trailing 12-month average. The most common approach, and generally the fairest default. It smooths out seasonality, one-off spikes, and month-to-month noise across a full operating cycle.
- Trailing 3- or 6-month average. Favors whichever side benefits from the most recent trend. A seller with a growing book of receivables often prefers a shorter window because it captures higher recent balances.
- Same-month prior year. Used for genuinely seasonal businesses (landscaping, holiday retail, agriculture) where comparing April to April matters more than a rolling average.
None of these work without normalization first. That means stripping out one-time anomalies (a bad receivable write-off, a one-quarter inventory buildup ahead of a product launch), applying accounting policies consistently across every period, and calculating a real monthly balance before averaging, not a rough estimate.
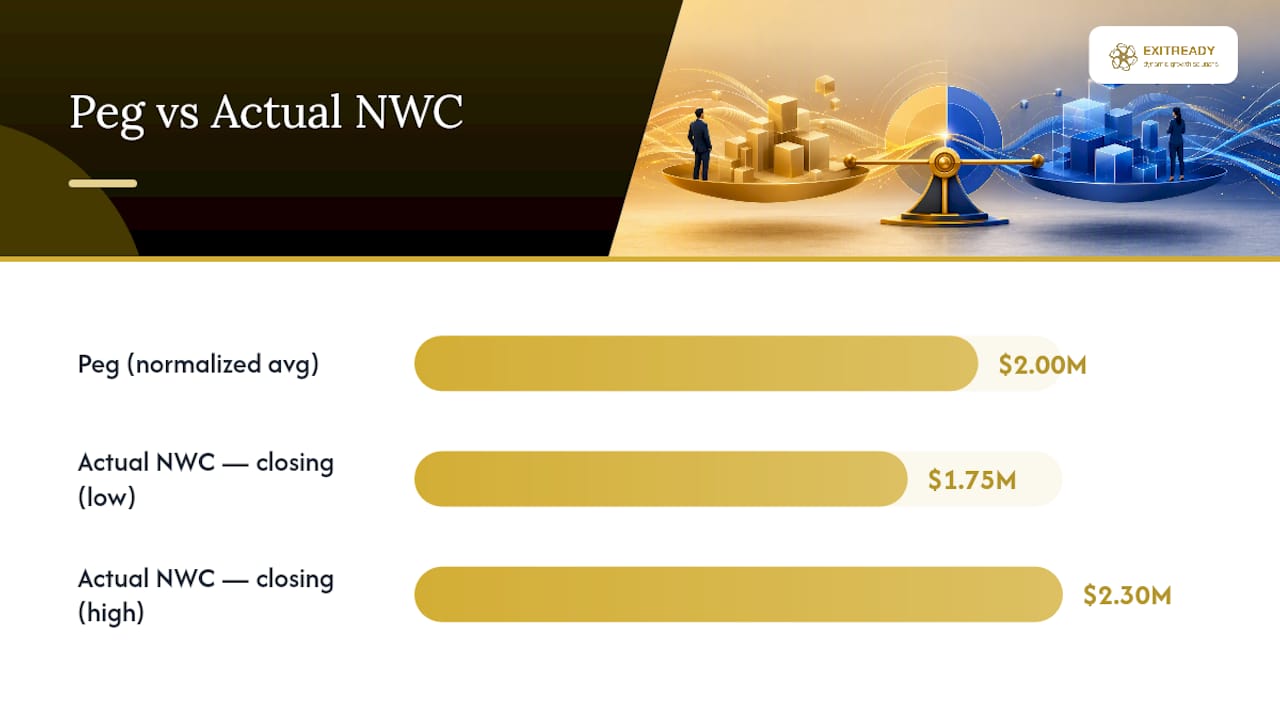
Here’s how it plays out with numbers. Say a company’s monthly net working capital over the trailing 12 months looks like this: $1.8 million, $2.1 million, $1.9 million, $2.3 million, $2.0 million, and so on, averaging out to a peg amount representative of the normalized working capital. At closing, the buyer’s accountant calculates actual NWC at $1.75 million, based on a closing-date balance sheet.
That’s a $250,000 shortfall against the peg. Under a dollar-for-dollar adjustment, the seller owes the buyer $250,000 out of escrow or directly from proceeds; no negotiation, no discretion, just the mechanical formula agreed to months earlier. Flip the numbers, and if actual NWC comes in at $2.3 million, the buyer owes the seller the $300,000 surplus.
Statistic Callout: Schneider Downs notes that the most common calculation window is a 6-month or 12-month trailing average precisely because it smooths out the seasonality and business-cycle swings that make a single-month snapshot unreliable.
Timing, the True-Up, and What Happens When Numbers Don’t Match
The measurement date matters more than most sellers expect going into negotiations. A closing-date snapshot captures the business exactly at the moment of transfer, while an end-of-month measurement is administratively easier but can miss a few days of activity that swing the number meaningfully on a cash-intensive business.
The mechanics after signing typically run like this:
- The buyer prepares a draft closing statement showing actual NWC as of the measurement date.
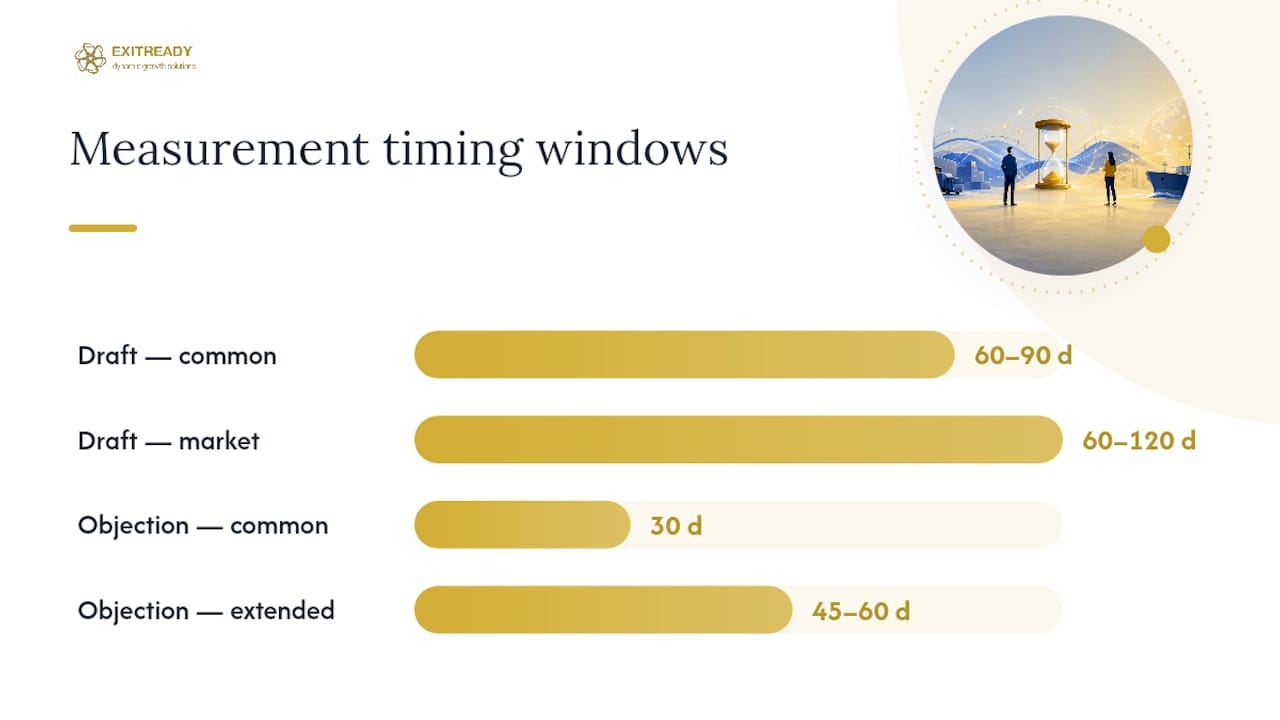
- Delivery of that statement commonly happens 60 to 90 days after close, with 60 to 120 days seen across the market.
- The seller then gets an objection window, commonly 30 days, to review and dispute the calculation.
- Unresolved disagreements go to an independent accountant, sometimes called an umpire, whose scope should be limited strictly to the disputed line items, not a full re-audit.
Schneider Downs points out that seller-side advisers frequently push to extend that 30-day objection window to 45 or even 60 days, and for good reason: 30 days is not much time to gather workpapers, engage an accountant, and build a credible objection while also running the business post-close.
Pro Tip: Negotiate a tolling provision that pauses the objection clock while you wait on the buyer to produce supporting workpapers. Without it, a slow document handoff can quietly eat into your review window before you’ve seen a single number.
Access to workpapers is where a lot of sellers get outmaneuvered. If the SPA doesn’t explicitly require the buyer to hand over supporting schedules, general ledger detail, and the accountant’s calculation methodology within a set number of days, sellers end up disputing a number they can’t actually verify.
Negotiation Levers That Protect Both Sides of the Table
The single biggest lever in any working capital peg negotiation is locking methodology before the letter of intent (LOI) turns into a signed SPA. Once the definition, averaging window, and accounting policies are set in the LOI, renegotiating them later becomes an uphill argument.
- Require formula consistency. The same calculation methodology used to set the historical peg must apply to the post-close true-up. A buyer who quietly switches accounting treatment between signing and closing is the most common source of disputes.
- Use a collar to absorb noise. A collar, say plus or minus $50,000 or 1 to 2% of the peg, means small accounting variances don’t trigger a dollar-for-dollar adjustment at all. Salt Creek Advisory frames collars as a practical compromise that keeps minor bookkeeping differences from becoming a full repricing event.
- Cap downside exposure. A cap, often 5 to 10% of headline purchase price, limits how much a seller can lose to a true-up even if the shortfall runs larger. This matters most for sellers rolling proceeds into retirement or a new venture where cash certainty counts.
- Specify deliverables and escrow sizing. Name exactly what workpapers get delivered, on what timeline, and size the escrow to realistically cover the plausible adjustment range, not an arbitrary round number.
Statistic Callout: Advisory sources describe collar thresholds around tens of thousands of dollars or low single-digit percentages of the peg, paired with caps that limit downside exposure to a moderate fraction of the purchase price, as typical seller protections in mid-market SPAs.
A Preparation Checklist Before You Sign the LOI
Preparation before the LOI stage determines whether the peg negotiation goes smoothly or turns into a six-week fight over spreadsheets.
For sellers:
- Run the peg under at least two methodologies, trailing 12-month and trailing 3-month, and see which one actually favors your business’s trend.
- Normalize anomalies now: write off dead inventory, clean up aged receivables, and document any one-time events before a buyer’s accountant finds them first.
- Build a detailed calculation exhibit with monthly balances and supporting workpapers ready to hand over, not assembled after a buyer asks.
For buyers:
- Insist on standardized schedule templates so the historical calculation and the closing calculation use identical line items.
- Run sensitivity models across methodology choices before agreeing to terms, since the averaging window choice alone can move the number by a meaningful percentage.
- Size escrow and cap thresholds based on that sensitivity range, not a flat industry rule of thumb.
Both sides benefit from agreeing on timelines, a tolling provision, and the dispute mechanism (independent accountant, scope limits) before signing anything, rather than leaving it to be fought out after the deal closes.
Pro Tip: Build your calculation exhibit in a format that ties directly to your monthly financial close, not a one-off reconstruction. A business with clean, documented monthly closes can produce a defensible peg schedule in days instead of weeks.
Why Documented Financial Discipline Wins Peg Negotiations
Businesses with monthly close discipline and documented accounting policies produce defensible historical averages fast, because the workpapers already exist instead of needing reconstruction under deal pressure. Strategic finance advisors typically build the SPA exhibit, stress-test methodology choices against seasonality, and model collar and escrow sizing before terms get locked. Dynamicgrowthsolutions works with mid-market owners on exactly this kind of preparation, including the role clean financials play in exit outcomes.
The Peg Fight Nobody Prepares For
Most owners spend months negotiating the headline purchase price and almost no time on the peg language, then discover at closing that the true-up moved proceeds by six figures. The methodology and exclusion list matter more than the multiple in the first ninety days after signing. Model your peg under two averaging windows this week, before your LOI locks in language you didn’t fully vet.
— Andre
Reduce Peg Risk Before You Ever Get to the Negotiating Table
There are consulting options available that help avoid walking into a peg negotiation with reconstructed financials and no calculation exhibit ready. Clean, documented monthly financials built ahead of a deal give sellers a defensible historical average and hand buyers the workpapers they need without a scramble, which is exactly the leverage that keeps a true-up from eating into headline proceeds.

That preparation is a core piece of what Dynamicgrowthsolutions builds into its business transformation programs for mid-market executives, covering the operational cleanup, documented financial policies, and exit-readiness work that make a working capital peg negotiation a formality instead of a fight. If you’re preparing for a sale in the next 12 to 24 months, start by getting a clear picture of where your financials and operations stand today, and where a buyer’s accountant is likely to push back.
Sources
- Understanding the Net Worth Capital Peg in M&A Transactions | Schneider Downs
- The Working Capital Peg in M&A 2026 | Salt Creek Advisory
- Working capital adjustments, explained: The peg, the true-up, and the fight you didn’t see coming – Montague Law