

Sales capacity planning is the process of calculating how much revenue your current or planned sales team can realistically produce, based on headcount, ramp status, and actual attainment rather than assigned quota. The core formula is straightforward: capacity = sum of (quota × attainment rate × ramp factor) for every rep on the roster, adjusted for attrition and vacancy lag.
The immediate recommendation, before you build anything in a spreadsheet: use a bottom-up or hybrid model, plug in trailing attainment instead of theoretical quota, and rerun the whole thing every month, not once a year.
Most capacity plans fail for one reason. Historical attainment data consistently shows that a meaningful share of account executives miss quota, which means a plan built on quota alone systematically overstates what your team can deliver.
Before modeling anything, gather these four inputs:
- Rep roster with hire dates, roles, and segment tags
- Trailing 12-month attainment by segment and tenure
- Cohort-based ramp curves showing time to full productivity
- Attrition rates and average backfill/vacancy lag
Key Takeaways
Sales capacity planning works only when it’s built bottom-up from trailing attainment and ramp curves, refreshed monthly, and stress-tested against named bear and bull variables.
| Point | Details |
|---|---|
| Use attainment, not quota | Trailing attainment reflects real productivity; quota-based models overstate achievable revenue. |
| Build bottom-up or hybrid | Sum ramp-adjusted contribution per rep rather than using a blended top-down average. |
| Adjust for ramp and attrition | A rookie cohort and backfill lag can cut effective capacity by 30% or more versus headcount alone. |
| Refresh monthly, own it jointly | RevOps, finance, and sales leadership should share ownership of a single source of truth. |
| Get outside structure when needed | Dynamicgrowthsolutions’s AOS embeds capacity discipline into documented playbooks and accountability rhythms for teams that can’t sustain the cadence alone. |
Table of Contents
- What Is Sales Capacity Planning and Which Model Fits Your Team?
- What Data Do You Need Before You Model Capacity?
- How Do You Calculate Sales Capacity? A Worked Example
- How Do You Stress-Test a Capacity Plan?
- What Are the Most Common Sales Capacity Planning Mistakes?
- Who Should Own the Capacity Model and How Often Should It Run?
- Spreadsheet or Software: What Should You Build the Model In?
- How Does Dynamicgrowthsolutions Operationalize Capacity Planning?
- How Does Capacity Planning Improve Revenue Forecasting Accuracy?
- How Should Capacity Planning Connect to Sales Enablement?
- How Do Sales Capacity Metrics Compare Across Industries and Company Sizes?
- Get a Clear Read on Your Team’s Real Capacity
- Sources
What Is Sales Capacity Planning and Which Model Fits Your Team?
A sales capacity model derives the maximum achievable revenue from your team’s size and productivity, factoring in ramp time, attainment, and average deal value. That’s different from a sales forecast, which predicts what you’ll actually close this quarter based on pipeline and deal stage. Capacity planning answers a longer-term question: given the reps you have (or plan to hire), what’s the ceiling on what they can produce?
There are three ways to build the model.
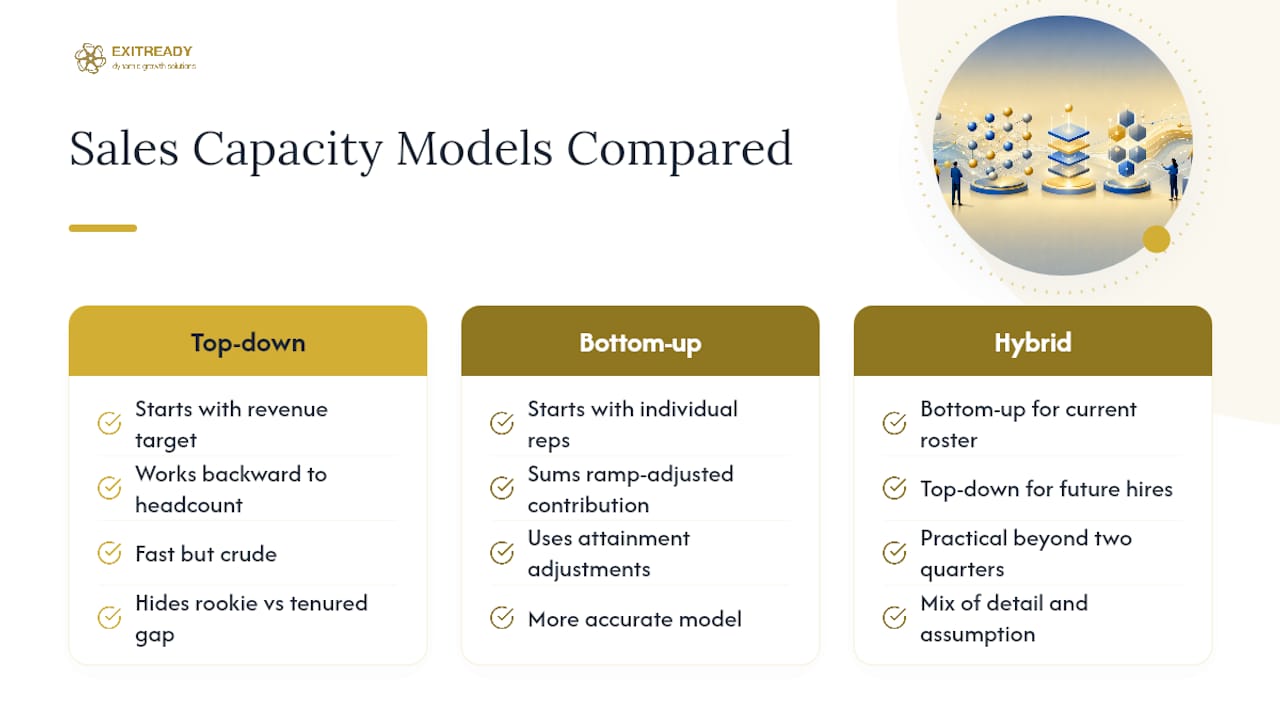
Top-down starts with a revenue target and works backward to headcount using an average productivity assumption per rep. It’s fast but crude. It hides the fact that a rookie and a tenured rep produce wildly different results.
Bottom-up sums ramp-adjusted, attainment-adjusted contribution for every individual rep or cohort, then rolls up to a team total. It’s more accurate and it’s the model most growth-stage and mid-market companies should default to.
Hybrid uses bottom-up detail for the current roster and top-down assumptions for planned future hires you haven’t sourced yet. This is often the practical answer once you’re forecasting more than two quarters out.
Here’s where most teams go wrong: they plug in quota, not attainment, and treat every rep as if a full quarter of productivity starts on their hire date. The FFI Standard specifically warns that building a model on theoretical quota instead of historical attainment overstates achievable revenue before you’ve hired a single person.
What Data Do You Need Before You Model Capacity?
You can’t build a credible capacity model from gut feel or last year’s number rounded up. You need six categories of data, and most of them already live in systems you’re paying for.
- Rep roster — every current and planned rep, with start date, role (AE, SDR, account manager), and segment or territory tag. Pull this from your HRIS and CRM, and reconcile the two, because they rarely match perfectly.
- Trailing attainment by segment and tenure band — not company-wide average attainment, but attainment sliced by segment (enterprise vs. mid-market) and by how long each rep has been in seat. A rep in month 14 performs differently than one in month 3.
- Cohort-based ramp curves — group reps hired in the same quarter and track their attainment trajectory month over month. This is how you derive a realistic ramp factor instead of guessing “90 days to full productivity” for every hire regardless of role complexity.
- Attrition by tenure and vacancy/backfill lag — how long, on average, does a seat sit empty between a rep leaving and a replacement becoming productive? This lag is one of the most underestimated capacity killers.
- Territory potential and pipeline coverage ratios — how much addressable opportunity exists in each territory, and how much pipeline coverage you’re carrying against quota in that territory.
- Data hygiene checks — confirm your CRM’s “closed won” definition matches finance’s revenue recognition, and strip out house accounts or split-credit deals that inflate individual attainment numbers.
Pro Tip: Pull attainment data at the segment and cohort level before you touch a spreadsheet formula. A single company-wide attainment percentage will hide the fact that your enterprise reps ramp in five months and your mid-market reps ramp in two.
The biggest pitfall at this stage isn’t missing data. It’s stale data. Payroll and CRM records drift out of sync within a single quarter if nobody owns the reconciliation.
How Do You Calculate Sales Capacity? A Worked Example
Per-rep productive capacity comes down to three numbers multiplied together: quota, attainment rate, and a ramp factor between 0 and 1. A fully ramped rep carrying a $600,000 annual quota at 85% trailing attainment contributes $510,000 of adjusted capacity. A rep in month two of a five-month ramp, on the same quota, might carry a ramp factor of 0.2, contributing just $102,000 for that period.
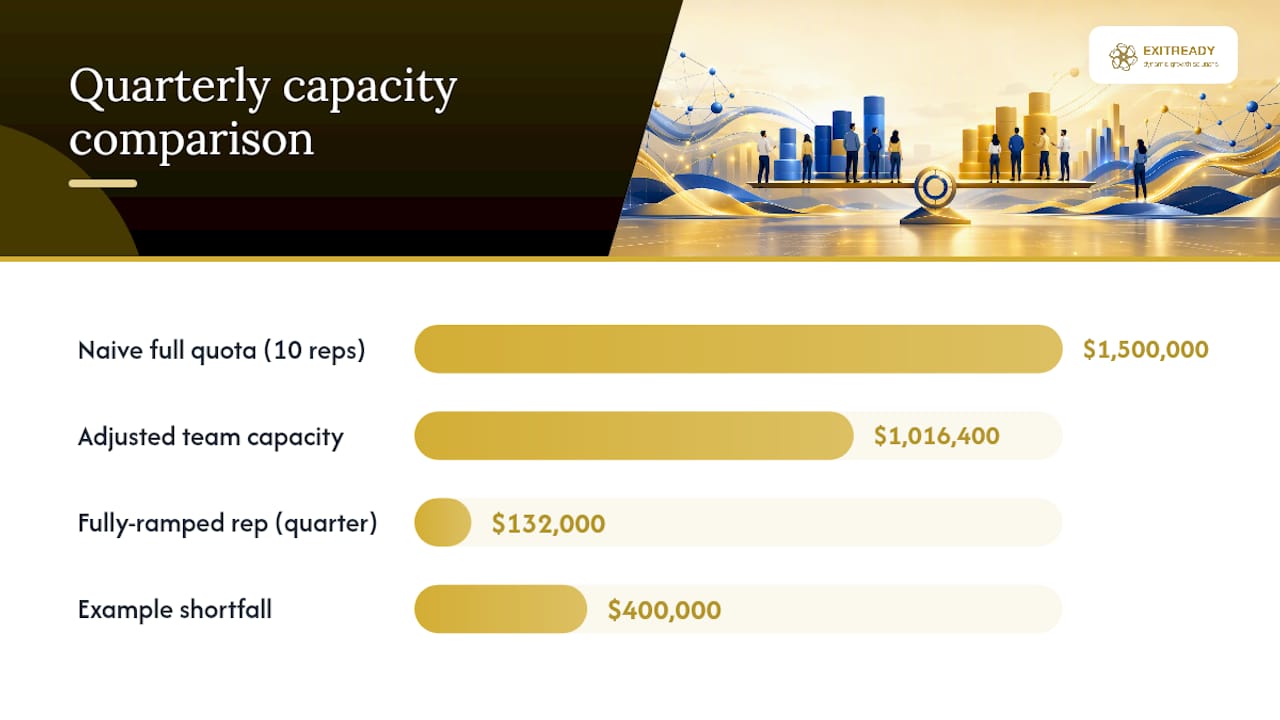
Here’s how it rolls up for a 10-rep mid-market team in a single quarter, using quarterly quota figures:
That team’s true adjusted capacity for the quarter is $1,016,400, not the $1,500,000 you’d get by simply multiplying 10 reps by full quota.
Building the model in practice:
- Calculate per-rep adjusted contribution using quota × attainment × ramp factor.
- Group and sum by cohort or segment to get a subtotal.
- Apply an attrition haircut: if you expect to lose two reps mid-quarter with a 45-day backfill lag, subtract their remaining productive quarter from the total.
- Sum all segments for total team capacity.
- Compare capacity to the revenue target. If the target exceeds capacity, calculate the headcount gap by dividing the shortfall by average fully-ramped rep contribution.
That last step is where capacity planning earns its keep. If you’re short $400,000 and a fully ramped rep contributes $132,000 a quarter, you need roughly three more reps, but they won’t be productive for months. Translating capacity into headcount requires the same ramp and attrition adjustments you used to build the original model, which is exactly why hiring decisions need to happen one to two quarters ahead of the revenue gap showing up.
How Do You Stress-Test a Capacity Plan?
A single-scenario capacity model is a guess dressed up as math. Run three scenarios, each anchored to one named variable so finance and your CRO can see exactly what’s being tested.
- Base case: your current trailing attainment, planned hire dates, and historical attrition rate, unchanged.
- Bear case: name one variable and move it against you. Try a 60-day hiring delay, a 15% attrition spike, or ramp time stretching from four months to six.
- Bull case: the inverse. Faster ramp from a new onboarding process, or attainment improving two points from a new enablement push.
Naming a single variable per scenario, rather than vaguely labeling a case “pessimistic,” is what makes the output defensible in a planning meeting. When finance asks why the bear case shows a $600,000 gap, you point to the one lever that moved, not five blended assumptions nobody can untangle.
Pro Tip: Run the bear case with a delayed hire date, not a headcount cut. Most real-world capacity misses come from slow hiring and long ramp, not from an intentional reduction in force.
When a scenario reveals a gap, the response isn’t always “hire more.” Sometimes it’s pulling territory boundaries tighter, shifting pipeline coverage targets, or accelerating enablement to compress ramp. Present all three scenarios together, with the named variable and dollar gap for each, so leadership is choosing a response to a specific risk rather than reacting to a single scary number.
What Are the Most Common Sales Capacity Planning Mistakes?
The same handful of errors show up across companies of every size, and they compound each other.
- Using quota instead of trailing attainment. This is the single biggest source of overstated capacity, and it’s the first thing to fix.
- Ignoring ramp entirely. Treating new hires as immediately productive is a close second, and it’s especially damaging for complex enterprise motions where ramp can run six months or longer.
- Blending segments together. Averaging enterprise and mid-market attainment into one number hides real performance gaps and misdirects coaching.
- Treating the model as an annual exercise. A plan built in January is stale by March if attrition or pipeline coverage shifts, which is exactly when leadership needs the number most.
- Forgetting overhead roles. Managers, sales engineers, and enablement staff don’t carry quota, but they absolutely constrain how fast reps ramp and how much capacity the team can sustain.
Every one of these mistakes has the same downstream effect: a revenue target that looks achievable on a slide and isn’t achievable in practice.
Who Should Own the Capacity Model and How Often Should It Run?
Capacity planning breaks down the moment it becomes a once-a-year spreadsheet exercise owned by whoever built the first version. It needs a standing operating rhythm.
- Refresh monthly. Attainment, attrition, and ramp status all shift month to month, and a stale capacity number gets cited in board meetings as if it’s current.
- Run a formal quarterly planning window where the monthly refresh feeds into hiring and quota decisions for the coming quarter.
- Assign joint ownership across RevOps, finance, and sales leadership. RevOps maintains the data pipeline, finance validates the assumptions against the P&L, and sales leadership owns the judgment calls on ramp and territory.
- Establish a single source of truth for every input, with version control and an audit trail so nobody’s arguing over which spreadsheet is current.
Set clear triggers for when the model forces a decision: a hiring freeze that pushes ramp timing, a quota change mid-year, or a territory redesign. Enterprise teams treat coverage, capacity, and ROI as one integrated planning function precisely because these levers move together, not in isolation.
Spreadsheet or Software: What Should You Build the Model In?
A spreadsheet is the right starting point for most mid-market teams. It’s cheap, transparent, and every finance leader already knows how to audit it. The tradeoff shows up at scale: once you’re managing more than 30 to 40 reps across multiple segments, manual spreadsheet updates become error-prone and slow to refresh monthly.
At that point, dedicated planning software becomes worth the cost. AI-native planning tools can turn a static annual spreadsheet into a live number that updates automatically as attainment, headcount, or attrition inputs change, which matters most when you’re running scenarios weekly rather than quarterly.
Whichever route you take, your template needs these fields at minimum:
- Rep name, role, segment, and hire date
- Quarterly or annual quota
- Trailing attainment rate
- Current ramp factor
- Adjusted capacity contribution (the calculated output)
| Template section | Fields to include |
|---|---|
| Roster | Rep, role, segment, hire date, manager |
| Productivity inputs | Quota, trailing attainment, ramp factor |
| Output | Adjusted capacity, attrition-adjusted total |
Hand the template off to RevOps once it’s built, with a documented refresh checklist, so the model survives past whoever created the first version.
How Does Dynamicgrowthsolutions Operationalize Capacity Planning?
Most capacity models die in a spreadsheet because nobody owns the discipline to update them. Dynamicgrowthsolutions built the Accelerated Operating System (AOS) around a different assumption: capacity planning only works when it’s embedded in a documented, repeatable operating rhythm, not treated as a one-time finance exercise.
The reps who ramp fastest aren’t the ones with the most natural talent. They’re the ones dropped into a documented playbook with clear accountability checkpoints from week one. That’s the gap between a capacity model that predicts reality and one that gets quietly ignored by quarter two.
AOS ties capacity math to the same documented playbooks and systemization that shorten ramp time and clean up the attainment data feeding the model in the first place. Certification and accountability rhythms exist specifically to catch data drift before it corrupts a quarterly refresh.
Pro Tip: If your team can build and defend the model internally, do it. Bring in outside structure when the model exists but nobody consistently owns the monthly refresh.
How Does Capacity Planning Improve Revenue Forecasting Accuracy?
A revenue forecast built on top of an unrealistic capacity number is wrong before the quarter even starts. Forecasting typically asks “what will we close,” using pipeline stage, deal velocity, and rep-level judgment. Capacity planning asks a prior question: “what’s physically possible given who’s selling and how ramped they are.” When you skip that second question, your forecast inherits every flaw in your headcount assumptions.
Consider the compounding effect. If a sales VP forecasts $2 million in new bookings for a quarter but the underlying capacity model, built honestly with ramp and attrition adjustments, only supports $1.6 million, that $400,000 gap doesn’t show up as a rounding error. It shows up as a missed board commitment, a scramble to discount deals to hit a number, or a late realization that half the “committed” pipeline sits with reps who aren’t fully ramped yet.
Tying capacity to forecasting also improves accuracy at the input level. Trailing attainment data, the same figure that feeds your capacity model, is a better predictor of what a rep will close next quarter than their assigned quota ever was. Building that continuity between capacity assumptions and forecast inputs removes one of the most common sources of forecast variance: treating every rep as equally likely to hit their number regardless of track record.
How Should Capacity Planning Connect to Sales Enablement?
Capacity planning and sales enablement are usually run by different teams that rarely talk to each other, which is a mistake. Ramp curves, the backbone of any capacity model, are directly shaped by how fast and how well new reps get trained.
If your capacity model assumes a five-month ramp to full productivity, enablement’s onboarding program is either supporting that assumption or quietly working against it. A generic onboarding deck with no role-play, no certification checkpoint, and no manager accountability tends to stretch ramp time well past whatever the spreadsheet assumes. That gap between assumed and actual ramp is one of the most common reasons a capacity plan and an actual quarter diverge.
The fix is structural, not aspirational. Enablement teams should track the same cohort data RevOps uses for capacity modeling: time to first deal, time to full quota attainment, and attainment trajectory by training cohort. When a new onboarding curriculum rolls out, compare the ramp curve of that cohort against the prior one. If it’s compressing ramp by even a few weeks, that’s a real, measurable improvement to team capacity, not just a training metric buried in an LMS dashboard.
The reverse matters too. When capacity planning reveals a segment where attainment is consistently below target for tenured reps, that’s an enablement signal, not just a hiring or territory problem. Coaching and skill gaps show up in the same attainment data driving your capacity math.
How Do Sales Capacity Metrics Compare Across Industries and Company Sizes?
Benchmarks vary enough by industry and deal complexity that borrowing a competitor’s ramp time or attainment target rarely translates cleanly to your own team. A transactional SaaS motion with a 30-day sales cycle ramps reps far faster than an enterprise infrastructure sale with a nine-month cycle and multiple stakeholders, and comparing the two directly will mislead your hiring math.
Company size changes the picture too. Smaller, growth-stage teams often carry higher variance in individual rep attainment because there’s less standardized enablement and territory design to smooth out performance gaps. Larger, more mature sales organizations tend to have tighter attainment distributions because territory potential, quota-setting, and onboarding are more rigorously modeled and refined over multiple hiring cycles.
Rather than chasing an external benchmark number, the more useful comparison is internal: how does this quarter’s cohort ramp curve compare to the last three cohorts you hired? Is attainment by tenure band trending up or down segment over segment? That internal trend line, tracked consistently, tells you more about whether your capacity plan is realistic than any industry average pulled from a report that doesn’t share your product, price point, or sales motion. Use external benchmarks as a sanity check on whether your assumptions are wildly out of range, not as the target itself.
A leadership perspective on getting capacity planning right
Most leaders treat capacity planning as a math problem, and that’s the mistake. It’s a discipline problem. The formula takes an afternoon to build; getting people to trust the number, refresh it monthly, and act on what it shows takes real organizational commitment. If I had to pick three priorities for this quarter: first, replace every quota-based assumption in your model with trailing attainment. Second, name your bear-case variable and run it before your CRO asks for it. Third, assign a single owner for the monthly refresh, because a model nobody updates is worse than no model at all.
— Andre
Get a Clear Read on Your Team’s Real Capacity
A spreadsheet tells you the math. It won’t tell you why your ramp curves are slower than they should be, why attainment data is inconsistent across segments, or why the same capacity gap keeps reappearing quarter after quarter. Dynamicgrowthsolutions built the Accelerated Operating System specifically to close that gap: documented playbooks, accountability rhythms, and certification processes that fix the operational root cause behind unreliable capacity numbers, not just the formula sitting on top of them.
If you’re not sure whether your capacity plan is exposing a real hiring gap or masking a deeper operational issue, start with the Growth Readiness Score Card to get a baseline read on where your operations stand. For leaders ready to go deeper, explore the business transformation programs built around AOS and book an assessment to see exactly where ramp time, data hygiene, or territory design is quietly costing you capacity. If external structure is what your team needs to execute the plan you’ve already built, a consulting partner like Marvin Growth Partners can also help translate strategy into execution.
Sources
The FFI Standard Glossary defines the core model and warns against quota-based overstatement. Lative covers cohort ramp curves and common modeling mistakes. Varicent addresses enterprise governance and cadence. The GTM Advisor Group provides a worked headcount translation example.
- Sales Capacity Model: FFI Standard Glossary
- What Is a Sales Capacity Model? With Examples | Lative
- Sales Capacity Planning: The Complete Guide for Revenue Operations — The GTM Advisor Group