
Enterprise value drivers fall into four buckets: financial drivers, growth drivers, operational efficiency drivers, and strategic or nonfinancial drivers. Each one moves the needle on what a buyer or lender will actually pay for your company, and most mid-market owners are only tracking one or two of them.
The highest-impact drivers to watch, regardless of industry, include:
- Revenue growth rate and its consistency year over year
- EBITDA margin and gross margin trends
- Free cash flow conversion
- Customer retention and concentration risk
- Recurring or contracted revenue as a share of total sales
- Proprietary technology, IP, or documented systems
- Management depth beyond the owner
- Operational transferability (can the business run without you?)
Start this week with a simple diagnostic: pull your last three years of financials and customer contracts, then flag which drivers above are strong, which are weak, and which you have never actually measured.
Pro Tip: Run the diagnostic before you talk to a buyer, a bank, or a broker. Owners who wait until they are mid-negotiation to discover a customer concentration problem lose leverage they can’t get back.
Key Takeaways
Enterprise value grows fastest when owners identify their top three to five drivers, assign KPIs and owners to each, and route every improvement through one of the four DCF levers.
| Point | Details |
|---|---|
| Classify before you measure | Separate financial drivers (revenue, margin, cash flow) from nonfinancial ones (brand, loyalty, systems) before setting KPIs. |
| Route improvements through the DCF levers | Every initiative should increase cash flow, growth, growth duration, or reduce cost of capital. |
| Avoid double-counting intangibles | Credit each valuation improvement to one driver only, not stacked across categories. |
| Assign an owner to every KPI | Metrics without a named owner rarely move, according to KPMG’s transformation research. |
| Operationalize with a documented system | Dynamic Growth Solutions’ AOS maps prioritized drivers to playbooks and dashboards tied to valuation outcomes. |
Table of Contents
- What Is an Enterprise Value Driver, and Why Does the Type Matter?
- Types of Enterprise Value Drivers and How to Measure Them
- How to Identify Your Business’s Top Value Drivers
- How Driver Improvements Actually Flow Through to Valuation
- Turning This Into a Dashboard You Can Actually Manage
- Your 90-Day and 12-Month Value Creation Roadmap
- Where Value Creation Efforts Usually Go Wrong
- How Dynamic Growth Solutions Turns These Drivers Into a Growth Plan
- Frequently Asked Questions
- Sources
What Is an Enterprise Value Driver, and Why Does the Type Matter?
A value driver is any measurable factor that changes what your business is worth to a buyer, lender, or investor, whether or not it shows up on your income statement. That last part is the distinction most owners miss. Financial value drivers are quantitative and hit your books directly: revenue growth, profit margins, cash flow, cost discipline. Nonfinancial drivers are qualitative and work indirectly, things like brand reputation, customer loyalty, governance quality, and employee engagement, but they still shape long-term profitability and what a buyer is willing to pay.
Here’s the framework that ties both categories back to a dollar figure. Using a discounted cash flow lens, a company’s value only moves through four routes: increase cash flows from assets already in place, increase expected growth, extend how long that high-growth period lasts, or reduce the cost of capital. Every driver you improve, whether it’s a financial metric or a soft factor like customer loyalty, ultimately has to route through one of those four levers or it isn’t actually changing enterprise value.
- Cash flow route: margin improvement, working capital efficiency, pricing power
- Growth route: new markets, product expansion, sales capacity
- Duration route: competitive moats, IP protection, contract lock-in
- Cost of capital route: reduced customer concentration, stronger governance, diversified revenue
Bain research found that fewer than 20% of companies deliver both positive economic profit and real top-line growth in the same year, and almost none sustain that combination for a full decade. That statistic alone should tell you something: durable enterprise value creation is rare enough that a mid-market company doing it consistently has a genuine competitive edge.
Pro Tip: Don’t stack a “brand premium” and a “growth premium” on top of the same improvement. If better customer retention is already lifting your growth rate, you’ve captured that value once. Counting it again under “brand equity” is double-counting, and it’s the fastest way to produce a valuation number nobody will believe.
Types of Enterprise Value Drivers and How to Measure Them
Every driver worth tracking falls into one of four categories, and each one has KPIs you can start pulling from your existing systems this month.
Financial drivers
These are the numbers a buyer’s diligence team checks first. Revenue growth should be measured as a percentage year over year, ideally broken into organic versus acquired growth. A realistic 90 to 365 day initiative here is cleaning up pricing tiers and eliminating quiet discounting that erodes the top line without anyone noticing.
Gross margin and EBITDA margin are the next stop. If your EBITDA margin sits below industry benchmarks, a vendor renegotiation or SKU rationalization project can often move it within two quarters. Free cash flow conversion, the share of EBITDA that actually turns into usable cash, matters just as much as the margin itself. A business with strong margins but poor cash conversion, often due to working capital drag, gets penalized in diligence every time.
Growth drivers
Market position, pricing power, and product pipeline strength determine whether your growth is likely to continue or stall. Track new customer acquisition rate, average deal size, and win rate against competitors as your core KPIs. An initiative like expanding into an adjacent customer segment or launching a tiered pricing structure typically shows measurable movement within two to three quarters, not overnight, but fast enough to matter for a near-term valuation event.
Operational efficiency drivers
This is where a lot of hidden value sits, unnoticed because it doesn’t show up as a single dramatic number. Asset turnover, cost per unit, and process cycle time are the metrics to watch. A billing system cleanup or an inventory turn improvement project is a classic 90-day win here. It rarely makes headlines, but it directly lifts free cash flow, which routes straight back to the DCF cash flow lever.

Strategic and nonfinancial drivers
Brand strength, customer loyalty, IP ownership, leadership depth, and operational transferability round out the list, and they often carry more weight in a sale than owners expect. Nonfinancial factors like brand reputation, product innovation, and succession planning can materially affect a buyer’s willingness to pay even before they show up in your financial statements. Track Net Promoter Score, customer churn rate, and CAC to LTV ratio as your leading indicators. Common valuation drivers also include economies of scale, proprietary technology, access to capital, and a company’s overall strategic vision, factors that rarely appear on a balance sheet but shape almost every term sheet.
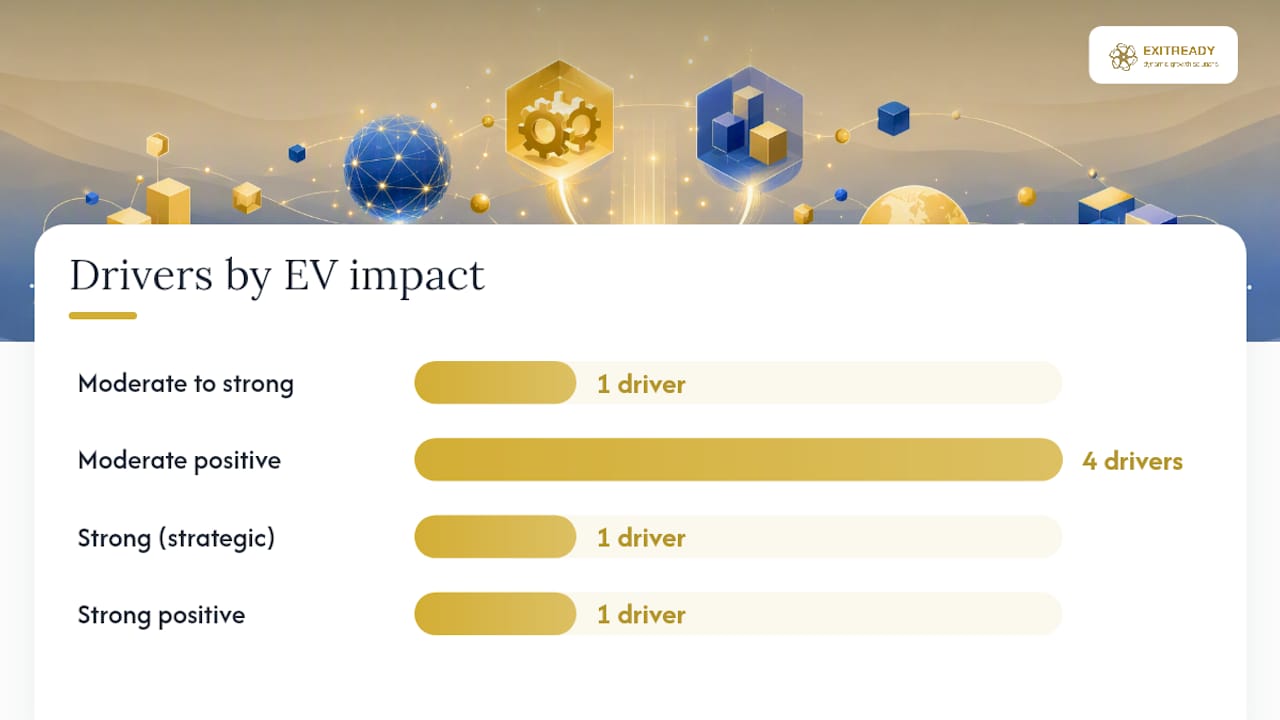
| Driver | Key KPI(s) | 90 to 365-day initiative | Typical EV impact direction |
|---|---|---|---|
| Revenue growth | Revenue growth %, organic vs. acquired split | Clean up pricing tiers, fix discount leakage | Moderate to strong positive |
| Margin structure | Gross margin, EBITDA margin | Vendor renegotiation, SKU rationalization | Moderate positive |
| Cash conversion | Free cash flow conversion % | Tighten receivables, renegotiate payment terms | Moderate positive |
| Customer loyalty | NPS, churn rate | Retention campaign, onboarding redesign | Moderate positive |
| Sales efficiency | CAC:LTV ratio | Refine ideal customer profile, sales training | Moderate positive |
| Technology and IP | Patent/trademark count, system documentation | Formalize IP registration, document core tech | Strong positive (strategic buyers) |
| Transferability | Owner-dependency score, documented playbooks | Delegate key decisions, build SOPs | Strong positive |
Pro Tip: Watch out for vanity metrics that look impressive but don’t route through any of the four DCF levers, like total website visits or app downloads with no conversion tie-in. If a metric doesn’t eventually touch cash flow, growth, duration, or cost of capital, it’s not a value driver. It’s just a number.
Pro Tip: Customer concentration is a silent multiple-killer. If one client represents more than 15-20% of revenue, buyers will discount your valuation regardless of how strong your other metrics look.
How to Identify Your Business’s Top Value Drivers
Most owners guess at what matters most. A short diagnostic tells you instead.
- Pull your core inputs. Gather three years of financial statements, a customer list segmented by revenue and contract length, your product roadmap, a current org chart, and a plain-language list of your tech stack.
- Map contract concentration. Flag any customer above 15% of revenue and any contract expiring within 12 months.
- Review your processes. Walk through your top five revenue-generating workflows and note which ones depend entirely on you or one key employee.
- Score each driver on impact versus controllability. Plot every driver you’ve found on a simple two-axis grid: how much it could move enterprise value on one axis, how easily your team can actually change it on the other.
- Prioritize the upper right quadrant first. High impact, high controllability items are your quick wins. Everything else waits.
A few data sources speed this up considerably:
- Industry benchmark reports for your sector’s typical EBITDA margins and growth rates
- A short NPS survey sent to your top 20 accounts
- A margin waterfall analysis breaking down where profit leaks between gross and net
- Payroll and org-chart review to spot single points of failure
This kind of value driver analysis works best as a repeatable habit, not a one-time exercise you run before a sale.
How Driver Improvements Actually Flow Through to Valuation
Here’s where the math gets concrete. KPMG’s approach to value creation typically quantifies enterprise value impact by multiplying an expected change in EBITDA by an anticipated shift in the valuation multiple itself, not just the dollar EBITDA change alone. That second part is what most owners miss entirely.
Say your company runs $5 million in EBITDA at a 5x multiple, putting enterprise value around $25 million. If a working capital and pricing initiative lifts EBITDA margin enough to add $500,000 in EBITDA, holding the multiple flat gets you to roughly $27.5 million. But if that same initiative also reduces customer concentration and adds recurring revenue, buyers may reasonably apply a 5.5x or 6x multiple instead, because the earnings now look more durable. The EBITDA gain and the multiple expansion compound. This is a simplified sketch, not a forecast. Real multiples depend heavily on sector, growth trajectory, and buyer type.
That trajectory matters because operating metrics like return on assets, revenue growth, and operating margin are the primary factors driving valuation multiples in the first place. Strategic buyers, the ones acquiring for synergy or market position rather than pure financial return, will often pay a premium above what a financial buyer’s model would justify, specifically because of nonfinancial fit factors like brand alignment or geographic reach.
| DCF lever | What it looks like in practice | Who cites it |
|---|---|---|
| Increase cash flows from assets | Margin improvement, working capital cleanup | Damodaran |
| Increase expected growth | New markets, product expansion | Damodaran |
| Extend high-growth duration | Competitive moats, contract lock-in | Damodaran |
| Reduce cost of capital | Lower customer concentration, stronger governance | Damodaran, KPMG |
Which metrics matter most depends heavily on your company’s lifecycle stage, sector, and existing cost of capital, so a driver that’s critical for a fast-growing SaaS business may barely register for a mature manufacturing company.
Pro Tip: When you build your own version of this math, resist the urge to add a “strategic premium” on top of an already-improved multiple unless a specific, named buyer type justifies it. Otherwise you’re valuing your business against a hypothetical bidder who may not exist.
Turning This Into a Dashboard You Can Actually Manage
Once you know your top drivers, the next problem is accountability. Use a simple prioritization matrix with three tiers: Gimmes are high-control, high-impact moves you can start now, like fixing billing leakage. Odds On are near-term process improvements with solid but not guaranteed payoff, like a retention campaign. Might Work covers longer strategic bets, like entering a new market, where impact is high but the outcome is less certain.
A minimal monitoring dashboard needs about six core metrics, reviewed on a consistent cadence, with a named owner for each:
- Revenue growth % (monthly, owned by finance)
- EBITDA margin (monthly, owned by finance)
- Free cash flow conversion (monthly, owned by finance)
- Customer churn rate (monthly, owned by customer success)
- NPS (quarterly, owned by customer success)
- CAC:LTV ratio (quarterly, owned by sales leadership)
| Tier | Example initiative | Review cadence |
|---|---|---|
| Gimme | Fix billing leakage | Weekly |
| Odds On | Launch retention campaign | Monthly |
| Might Work | Enter adjacent market | Quarterly |
Mid-market companies chasing meaningful EBITDA margin gains should expect the work to take multiple quarters, not weeks. Set targets in ranges rather than single numbers, and revisit them every quarter as new data comes in.
Your 90-Day and 12-Month Value Creation Roadmap
Quick wins in the first 90 days build momentum and cash. The structural work in year one builds the kind of durable value a buyer will actually pay a premium for.
90-day quick wins:
- Clean up pricing tiers and eliminate quiet discounting
- Fix billing and collections leakage
- Launch a targeted retention play for at-risk top accounts
- Document your three most owner-dependent processes
12-month structural projects:
- Build a documented playbook library covering core operations
- Reduce single-customer revenue concentration below 15%
- Upgrade core financial and operational systems for better reporting
- Add a layer of management depth so decisions don’t route through the owner
Owners who execute both waves typically see EBITDA margin gains in the low-to-mid single digits within a year, alongside a meaningful drop in customer churn, though results vary widely by sector and starting point.
Where Value Creation Efforts Usually Go Wrong
The same handful of mistakes show up across almost every transformation effort. Double-counting intangibles tops the list: crediting the same customer retention win to both “growth” and “brand strength” inflates your numbers without reflecting reality. Chasing vanity metrics like social followers or website traffic wastes energy on numbers that never route through an actual DCF lever.
Prioritizing short-term cash at the expense of long-term growth is another trap, cutting R&D or customer support to pad this quarter’s margin often costs more in churn and lost pipeline than it saves. KPMG’s research found that fewer than one in five transformation initiatives deliver significant value, largely due to weak governance and inconsistent measurement.
Pro Tip: Watch for the red flag of “improving” metrics with no named owner behind them. If nobody’s job depends on a KPI moving, it usually doesn’t move.
How Dynamic Growth Solutions Prioritizes Value Drivers
We built the Accelerated Operating System around exactly this problem: owners know their business has value drivers, but nobody’s mapped them, assigned an owner, or documented the playbook to move them. AOS maps each driver to a specific operational program with an accountable owner and a measurable dashboard tied back to valuation, not just activity.
How Dynamic Growth Solutions Turns These Drivers Into a Growth Plan
Reading a list of value drivers is one thing. Building the actual playbooks, assigning owners, and tracking whether your EBITDA margin and customer retention are moving in the right direction is a different job entirely, and it’s usually the job owners have no time left in the week to do themselves.

Dynamic Growth Solutions built the Accelerated Operating System specifically to close that gap. Instead of a generic consulting engagement, AOS starts with a diagnostic that scores your business against the exact driver categories covered above, then documents playbooks and assigns internal owners so the improvements don’t quietly disappear once the engagement ends. That combination of diagnostic plus documented execution plan is what separates a real valuation lift from a slide deck nobody implements. If you’re weighing outside financing to shore up cash flow while you work through this process, understanding how tools like a merchant cash advance affect your cost of capital is worth a look before you sign anything.
If you’re an owner who wants a clear picture of what your business is actually worth today and which levers would move that number fastest, start with the business operating system built for owners and see how AOS maps to your specific driver profile.
Frequently Asked Questions
What are the main types of enterprise value drivers?
The main types of enterprise value drivers are financial drivers (revenue growth, margins, cash flow), growth drivers (market position, pricing power, pipeline), operational efficiency drivers (asset turnover, cost structure), and strategic or nonfinancial drivers (brand, customer loyalty, IP, leadership depth).
How do nonfinancial drivers affect enterprise value if they’re not on the balance sheet?
Nonfinancial drivers like brand reputation and customer loyalty shape a buyer’s confidence in future cash flows, which affects both the growth assumptions and the multiple a buyer applies, even though the drivers themselves never appear as a line item.
What KPI should a mid-market owner track first?
Start with free cash flow conversion and customer concentration. Both expose problems quickly and both route directly through the cost of capital and cash flow levers in a discounted cash flow model.
How long does it take to see valuation impact from driver improvements?
Quick operational wins like billing cleanup show cash flow impact within 90 days. Structural changes like reducing customer concentration or building management depth typically take 12 months or longer to fully show up in a valuation.
Can a business have strong financial drivers but still get a low valuation?
Yes. A business with strong margins but heavy owner dependency, thin management bench, or high customer concentration often gets valued lower than its financials alone would suggest, because buyers discount for transferability risk.
This article is general information, not a substitute for advice from a qualified financial advisor. Consult a qualified financial professional about your own circumstances before acting on anything here.
Sources
- What Are Value Drivers? Financial vs Nonfinancial
- Sustained value creation — the test of the best (infographic)
- Value Enhancement: Back to Basics (Aswath Damodaran)
- Valuation drivers — examples and explanation (Corporate Finance Institute)