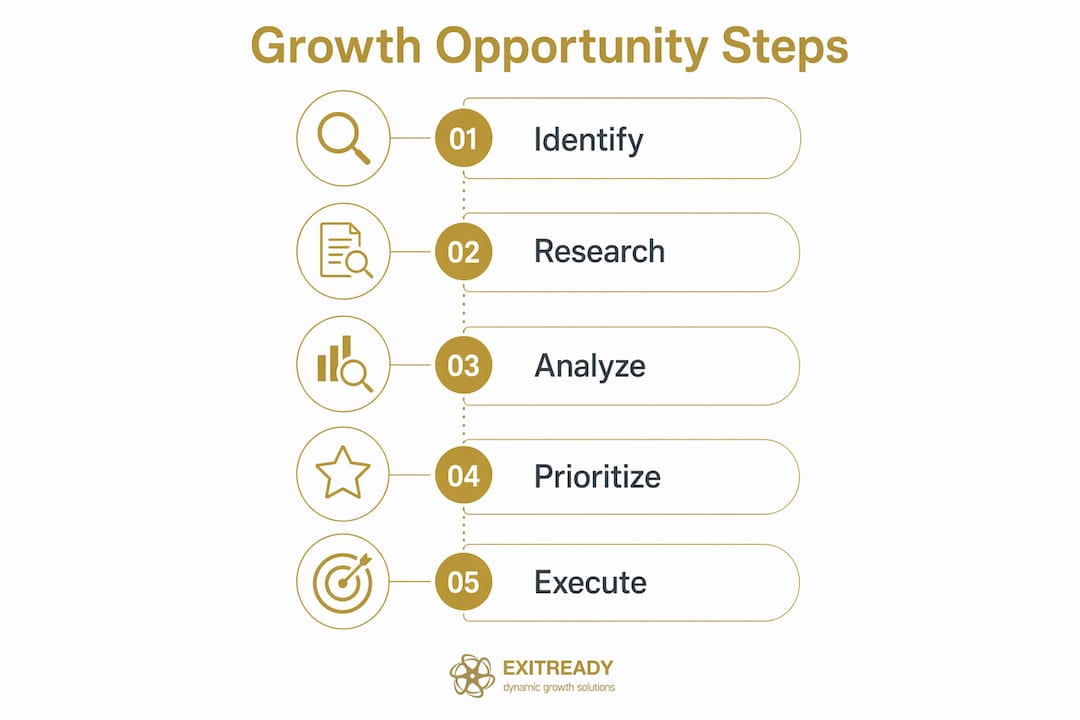
Hidden growth opportunities are defined as untapped revenue potential that exists within or adjacent to your current business activities, waiting to be uncovered through deliberate analysis rather than accidental discovery. Most mid-market owners leave significant revenue on the table not because the opportunities don’t exist, but because they rely on intuition and past performance instead of structured methods to find them. Tools like whitespace analysis, Google Trends, customer churn analysis, and asset optimization give you a repeatable system to identify hidden growth opportunities in your business before competitors do. Frameworks from ITONICS, Cognitivemarket Research, and LinkedIn’s sales intelligence research all confirm that structured, repeatable frameworks increase the predictability of successful market entry. The difference between businesses that scale and those that stagnate is rarely luck. It’s methodology.
Thank you for reading this post, don't forget to subscribe!How can whitespace analysis reveal hidden growth opportunities in your business?
Whitespace analysis is the practice of identifying unoccupied zones in your market where demand exists but supply is thin or fragmented. It is one of the most direct methods to discover business growth areas without the cost and risk of entering entirely new markets. Research shows that whitespace analysis detects growth potential in areas like modular product design and Edge-Intelligence sensors for B2B manufacturing companies. That finding matters because it shows whitespace isn’t abstract. It maps to real product categories and real industrial segments your sales team can target today.
To execute whitespace analysis effectively, you need to layer multiple data types:
- Technographic data: What tools and platforms do your target accounts currently use?
- Firmographic intelligence: Company size, industry, growth stage, and revenue range.
- Spend signals: Where are prospects currently allocating budget, and where are gaps visible?
- Buyer intent data: Which accounts are actively researching solutions in your category right now?
The real power comes when you embed intent signals into your CRM and sales workflows. This moves whitespace from a quarterly research exercise into a live targeting system. Sales reps stop calling cold lists and start calling accounts that are already in-market.
Pro Tip: Use platforms like TrustRadius or G2 to identify accounts researching your category. Cross-reference their tech stack signals with your existing customer profiles to find the highest-fit whitespace targets.
| KPI | What it measures |
|---|---|
| Whitespace account conversion rate | Percentage of identified whitespace accounts that convert to pipeline |
| Time to first meeting | Speed of engagement with intent-flagged accounts |
| Revenue from new segments | Dollar contribution from previously unserved market zones |
| CRM coverage ratio | Percentage of total addressable accounts with enriched data profiles |
What role does trend analysis and content gap research play in finding untapped markets?
Trend analysis is the practice of reading demand signals before they become obvious to the broader market. Every growth opportunity moves through a lifecycle: weak signal, rising, peak, and declining. Entering at the weak signal or rising stage gives you more runway to build brand authority and face less competition intensity. By the time a trend hits peak, margins compress and differentiation becomes expensive.
Free tools make this accessible to any mid-market owner:
- Google Trends: Filter by 5-year view to separate genuine upward trajectories from seasonal spikes.
- TikTok Creative Center: Reveals emerging consumer demand signals weeks before they appear in search data.
- Etsy search and Reddit forums: Surface niche pain points and product requests from highly specific buyer communities.
- AnswerThePublic and AlsoAsked: Map the questions buyers are asking that no one is answering well yet.
Niche terms with consistent upward trends and low content saturation signal high-potential entry points before competitors move in. The interpretation here is straightforward: if search demand is rising but content supply is thin, you have a window to own that space with authority content, a new product line, or a targeted service offering.
Beyond search data, look at emotional and functional customer needs. A customer who needs to “track field technician performance” has a functional need. The emotional need underneath it is “I want to stop being surprised by missed SLAs.” Products and services that address both layers command premium pricing and stronger retention.

Pro Tip: Watch for workaround behavior. When customers are duct-taping together spreadsheets, Zapier automations, and manual processes to solve a problem, that is validated demand for a cleaner solution. Workarounds are the market telling you exactly what it needs.
| Tool | Best use case | Cost |
|---|---|---|
| Google Trends | 5-year demand trajectory analysis | Free |
| TikTok Creative Center | Early consumer trend detection | Free |
| Etsy search | Niche product demand signals | Free |
| AnswerThePublic | Content gap and question mapping | Free/paid |
| G2 / TrustRadius | Buyer intent and tech stack signals | Paid |
How to leverage internal data and customer insights to identify untapped revenue streams
The fastest path to new revenue is often inside your existing business. Customer churn, lost sales, and website drop-offs reveal overlooked revenue opportunities by highlighting exactly where demand slips away. Most owners review these metrics reactively. The owners who grow systematically treat them as a prospecting database.
Here is a practical sequence for mining internal data for growth signals:
- Audit lost sales reports. Pull the last 12 months of deals you lost. Categorize by reason: price, feature gap, timing, competitor win. Patterns in feature gaps or competitor wins point directly to product or positioning opportunities.
- Map website funnel drop-offs. Use Google Analytics 4 or Hotjar to identify where visitors exit without converting. High drop-off on a pricing page often signals a packaging problem, not a price problem.
- Analyze product usage gaps. If you have a SaaS product or service tiers, identify which features or service components customers rarely use. Low adoption of a high-value feature is a training and communication opportunity, not a product failure.
- Interview frontline employees. Your sales reps and customer success managers hear objections and requests daily that never make it into a CRM note. A structured monthly debrief surfaces qualitative intelligence no dashboard can capture.
- Review customer lifetime value by segment. Hidden growth often stems from optimizing existing customer relationships rather than acquiring new ones. Identify your highest-LTV segment and ask what it would take to move more customers into that tier.
Understanding what causes business growth stagnation is often the prerequisite to finding where the real opportunity lies. Stagnation and hidden opportunity are two sides of the same coin.
Pro Tip: Map your customers’ “jobs to be done.” Ask not what they bought, but what outcome they were trying to achieve. The gap between the outcome they wanted and the outcome they got is your next product or service opportunity.
One critical distinction: differentiate between new markets you haven’t entered and existing markets you are serving poorly. Poorly served existing markets almost always offer faster payback and lower acquisition cost than new market entry. Start there.
Which frameworks help you prioritize growth opportunities with financial rigor?
Identifying opportunities is only half the work. Prioritizing them with financial discipline separates businesses that scale mid-market operations from those that chase every shiny signal and execute none well.
The TAM, SAM, SOM framework is the standard starting point. Total Addressable Market (TAM) is the full revenue opportunity if you captured 100% of the market. Serviceable Addressable Market (SAM) is the portion you can realistically reach with your current model. Serviceable Obtainable Market (SOM) is what you can capture in the near term given your resources and competitive position. Ignoring unit economics leads to costly failures even in apparently large or underserved markets. A $2 billion TAM means nothing if your customer acquisition cost exceeds your payback period by 18 months.
Beyond TAM/SAM/SOM, evaluate each opportunity against these criteria:
- Customer acquisition cost (CAC): What does it cost to win one customer in this segment?
- Payback period: How many months of gross margin does it take to recover CAC?
- Gross margin: Does this opportunity improve or dilute your current margin profile?
- Competitive barriers: How quickly can an incumbent or well-funded competitor replicate your move?
- Switching costs: Once a customer adopts your solution, how difficult is it for them to leave?
Sound opportunity analysis also requires quantifying the incumbent response. If you enter a segment and a dominant player responds within 90 days with a competing offer, your window closes fast. Build that scenario into your go/no-go decision.
| Evaluation criterion | Why it matters |
|---|---|
| TAM / SAM / SOM | Sets realistic revenue ceiling and near-term capture targets |
| CAC and payback period | Determines cash flow impact and investment sustainability |
| Gross margin contribution | Reveals whether growth adds or dilutes business profitability |
| Incumbent response speed | Predicts how long your competitive window stays open |
| Customer switching cost | Indicates retention durability once you win the account |
Key takeaways
Identifying hidden growth opportunities requires combining whitespace analysis, trend data, internal operational metrics, and financial frameworks into a repeatable system rather than relying on intuition or market timing.
| Point | Details |
|---|---|
| Whitespace analysis drives targeting | Embed technographic and intent data into CRM workflows to act on real demand pockets. |
| Trend entry timing is critical | Enter markets at the weak signal or rising stage to build authority before competition intensifies. |
| Internal data is an underused asset | Lost sales, churn data, and usage gaps reveal faster revenue paths than new market entry. |
| Unit economics determine viability | Evaluate CAC, payback period, and incumbent response before committing resources to any opportunity. |
| Workarounds signal validated demand | Customers patching solutions together are telling you exactly what product or service to build next. |
Why most mid-market owners are sitting on growth they can’t see
The most common pattern I see with mid-market owners is not a lack of opportunity. It’s a lack of the right lens to see what’s already there. Most owners I work with have been so deep in daily operations for so long that familiarity bias kicks in. They stop noticing the friction their customers experience because they’ve normalized it. They stop questioning why certain deals keep getting lost because losing has become an expected part of the pipeline.
The shift I advocate for is not dramatic. It starts with one structured monthly review of three data points: lost deal reasons, customer churn triggers, and the top five questions your sales team hears that they can’t answer well. That review, done consistently, surfaces more growth intelligence than most expensive market research projects.
What I’ve found is that the businesses growing fastest in the mid-market are not the ones with the most creative ideas. They are the ones with the most disciplined business assessment processes for reading signals that are already present in their data. The creativity comes later, in how you respond to what the data shows. The discipline comes first, in making sure you actually look.
One more thing worth saying plainly: chasing trends without financial filters is how good businesses waste good capital. Every opportunity that looks exciting in a Google Trends chart needs to survive a CAC and payback period stress test before you allocate real resources. The framework is not the enemy of ambition. It is what makes ambition sustainable.
— Andre
Ready to uncover the revenue hiding in your business?
Dynamicgrowthsolutions built the 360-ProfitDriver analysis specifically for mid-market owners who know growth is possible but can’t pinpoint exactly where to focus. It maps your hidden revenue gaps, operational bottlenecks, and untapped market segments into a clear priority list with financial projections attached.
If you want to move from insight to execution, Dynamicgrowthsolutions also offers strategic finance and cash flow systems designed to support scalable growth without burning through capital. And if you want to work through growth strategy alongside other high-performing CEOs, the EXITREADY CEO events bring together owners who are serious about building businesses that grow on systems, not on their personal effort.
FAQ
What is whitespace analysis in business growth?
Whitespace analysis identifies unoccupied zones in your market where demand exists but supply is thin or absent. Companies use technographic, firmographic, and buyer intent data to find these gaps and target them before competitors do.
How do I spot growth opportunities using internal data?
Analyze lost sales reasons, website funnel drop-offs, and customer churn triggers to find where demand is slipping away. These operational metrics reveal friction points and unmet needs faster than external market research.
What is the TAM, SAM, SOM framework?
TAM is your total market if you captured every customer, SAM is the portion reachable with your current model, and SOM is what you can realistically win near-term. Applying all three with realistic unit economics prevents over-investment in opportunities that look large but deliver poor returns.
How does trend analysis help find untapped market potential?
Tools like Google Trends and TikTok Creative Center detect demand signals at the weak signal or rising stage, before competition intensifies. Entering at this stage gives you time to build brand authority and capture market share at lower cost.
Why do mid-market businesses miss hidden growth opportunities?
Most mid-market owners rely on intuition and past performance rather than structured opportunity frameworks. Familiarity bias causes owners to normalize customer friction and stop questioning patterns in lost deals or underperforming segments.