
Growth diagnosis is the structured process of identifying the specific barriers preventing a business from expanding revenue, headcount, or market share. When your business plateaus, the cause is almost never what it looks like on the surface. 42% of senior executives missed their growth targets in 2025, up from 32% the year before. That jump tells you this is not a market problem. It is a diagnostic problem. Most mid-market owners try to diagnose why business stopped growing by adding headcount or increasing ad spend. Both moves treat symptoms. The real fix starts with a system-level review of revenue flows, operating architecture, and leadership capacity.
What are the warning signs your business has stopped growing?
Growth stagnation shows up in three places before it shows up in your bank account: your financials, your operations, and your leadership behavior. Catching it early in all three gives you more options and cheaper fixes.
Financial signals are the most obvious starting point:
- Flat or declining revenue for two or more consecutive quarters
- Rising customer acquisition cost (CAC) without a corresponding increase in lifetime value (LTV)
- Customer churn rate climbing above your new customer acquisition rate
- Gross margin compression despite stable pricing
Operational signals are subtler but more telling:
- The founder or CEO is the single approval point for decisions that should be delegated
- Reactive firefighting consumes more than 40% of leadership time each week
- Workflows are undocumented, meaning output depends on who is working rather than how the system runs
- New hires take longer than expected to become productive because onboarding is informal
Leadership signals confirm the pattern:
- You are working more hours than two years ago but revenue is flat
- Your team cannot execute a project without your direct involvement
- You feel like you are the only one who truly understands the business
Pro Tip: Track your own calendar for two weeks. If more than half your meetings are operational rather than strategic, you have already found your first bottleneck.
These signals rarely appear alone. When financial, operational, and leadership symptoms cluster together, the business has almost certainly hit a structural ceiling rather than a temporary dip.
How to perform a structured revenue diagnostic
A revenue diagnostic examines three distinct buckets: new customer revenue, existing customer revenue, and lost customer revenue. Each bucket points to a different root cause and demands a different fix.

The Revenue Bridge framework
The Revenue Bridge breaks your total revenue change into its component parts. Run it quarterly using this sequence:
- Calculate new customer revenue. How much revenue came from customers acquired this period? Compare CAC to LTV by segment and product tier.
- Calculate existing customer revenue. Did current customers expand, stay flat, or contract? Measure net revenue retention (NRR) separately from gross revenue retention.
- Calculate lost customer revenue. What is your churn rate by segment? Identify whether churned customers left due to price, product gaps, or service failures.
- Identify the largest gap. The bucket with the biggest negative delta is where you focus first, not where you feel most comfortable working.
- Layer in qualitative evidence. Pull themes from sales call recordings, customer exit interviews, and support tickets. Numbers tell you what is broken. Conversations tell you why.
60% of companies lack the foundational data needed to scale effectively. That means your first diagnostic task may be building the data infrastructure before you can run the analysis. Start with a simple spreadsheet segmenting revenue by customer cohort, product line, and acquisition channel.
| Diagnostic metric | What it measures | Red flag threshold |
|---|---|---|
| Customer acquisition cost (CAC) | Cost to acquire one new customer | Rising quarter over quarter |
| Net revenue retention (NRR) | Revenue growth from existing customers | Below 100% |
| Churn rate | Percentage of customers lost per period | Above new customer acquisition rate |
| LTV to CAC ratio | Return on customer acquisition spend | Below 3:1 |
| Payback period | Months to recover CAC | Above 18 months |
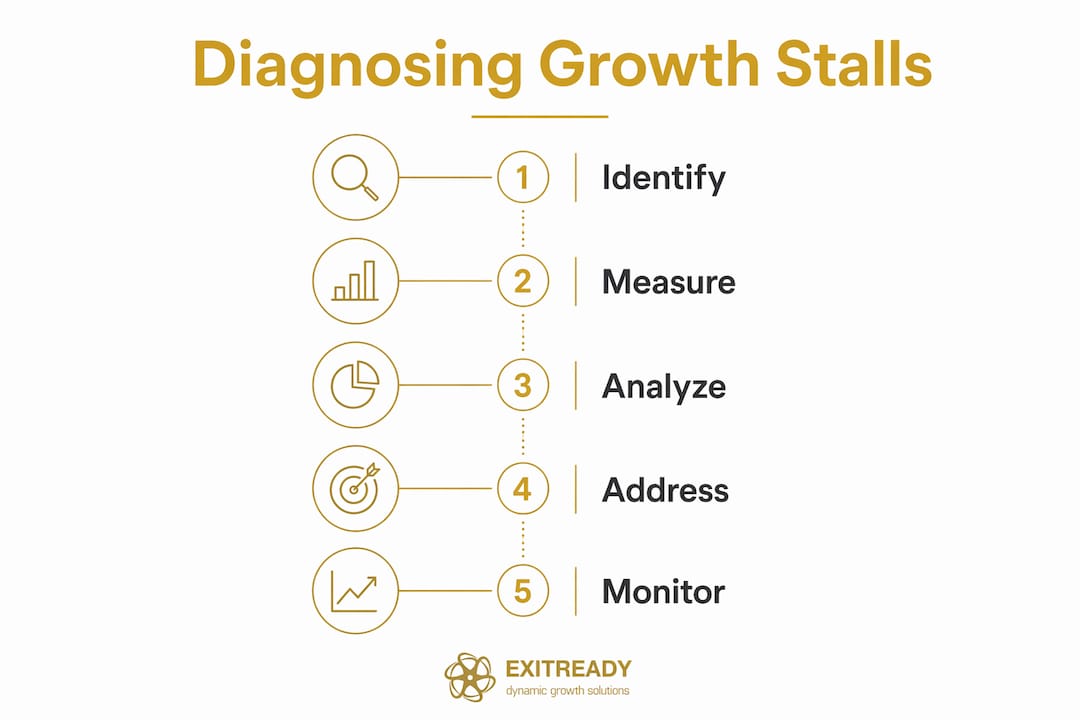
Diagnosing growth constraints deeply rather than chasing surface metrics like traffic or impressions is what separates high-growth firms from stagnant ones. Wasted marketing spend almost always traces back to fixing the wrong bucket.
Why founder dependency creates a hard ceiling on growth
87% of businesses stall because they try to push growth using the same operating model that worked at a lower revenue level. The founder bottleneck is the most common version of this problem.
A founder-dependent business has a throughput ceiling equal to the founder’s personal bandwidth. Every decision that requires the founder’s approval, every client relationship that only the founder can manage, and every process that only the founder understands is a hard cap on how fast the company can grow. Hiring more people without documented workflows does not reduce that ceiling. It raises the founder’s coordination load and often makes the bottleneck worse.
This ceiling becomes acute at predictable revenue thresholds. The transition from $3M to $10M requires moving from manual, founder-driven processes to repeatable revenue operations systems. Without that shift, growth stalls. The same transition happens again at $10M to $30M, where informal team coordination must give way to documented decision rights and KPI ownership.
The fix is not hiring a COO and hoping for the best. The fix is building what Dynamicgrowthsolutions calls Growth Architecture: the operating system that connects strategy to daily execution through documented processes, clear decision rights, and measurable accountability at every level.
- Documented standard operating procedures (SOPs) for every repeatable process
- Defined decision rights so team members know what they can approve without escalation
- KPI ownership assigned to specific roles, not just tracked by leadership
- A weekly operating rhythm that surfaces problems before they reach the founder
Founder dependency is the silent growth bottleneck limiting most mid-market firms. Structural change, not a quick hire, is the only lasting solution. Owners who want to understand the full scope of this problem can review why mid-market businesses plateau and the specific root causes that keep them stuck.
One additional factor compounds the problem: technology. Implementing AI without solid operational infrastructure multiplies inefficiencies rather than generating growth. Successful companies document and clarify operations first, then layer in technology for scale.
Step-by-step: how to diagnose and address a growth stoppage
A practical diagnostic follows a clear sequence. Skipping steps produces misdiagnoses. Misdiagnoses produce expensive, ineffective fixes.
- Map your customer journey and revenue flows. Draw the full path from first contact to closed deal to renewal. Mark every handoff between people or systems. Handoffs are where friction hides.
- Pull and review your financial metrics. Use the Revenue Bridge framework. Segment by product, channel, and customer cohort. Look for the quarter where growth first flattened and work backward.
- Audit your operational data. Measure cycle times for your core processes. How long does it take to onboard a new customer? How long to resolve a support issue? Slow cycle times signal undocumented or broken workflows.
- Collect qualitative feedback from three groups. Interview your five best customers, your five churned customers, and your frontline team members. Ask each group where they experience the most friction. The answers will not match your assumptions.
- Identify the single highest-impact bottleneck. Resist the urge to fix everything at once. Identifying the exact friction points in the customer journey is the defining habit of high-growth firms. Fix the one constraint that, if removed, would unlock the most downstream progress.
- Structure your fix as a 90-day sprint. Define a measurable outcome, assign ownership, and review progress weekly. Iterative sprints create accountability and produce data that refines your next diagnostic cycle.
Pro Tip: The most common misdiagnosis in mid-market businesses is attributing flat revenue to a marketing problem when the actual cause is a retention or onboarding failure. Check NRR before increasing your ad budget.
Only 4% of companies have a clearly defined value proposition, and companies with differentiated value propositions grow revenue at 19% versus 12% for those without one. If your diagnostic reveals weak positioning, that becomes a priority fix before any demand generation investment. Owners looking for hidden growth opportunities often find them in the gap between what they think their value proposition says and what customers actually hear.
Outsourcing non-core financial functions can also free up leadership bandwidth during a diagnostic period. Outsourced accounting services give owners cleaner data and more time to focus on the strategic work the diagnostic demands.
Key Takeaways
Diagnosing why business stopped growing requires a structured, system-level analysis of revenue flows, operating architecture, and leadership capacity before any fix can be effective.
| Point | Details |
|---|---|
| Run the Revenue Bridge | Segment revenue into new, existing, and lost customer buckets to find the largest gap. |
| Fix the founder bottleneck | Document processes and assign decision rights before adding headcount or technology. |
| Use qualitative and quantitative data | Combine unit economics with customer and team interviews for accurate root cause discovery. |
| Target one bottleneck at a time | Identify the single constraint with the most downstream impact and address it in a 90-day sprint. |
| Build before you scale | Clarify and document operations before investing in AI, marketing, or new hires. |
What most owners get wrong about growth stalls
The pattern I see most often is this: a mid-market owner watches revenue flatten, panics, and immediately increases the marketing budget. Three months later, CAC has risen, the team is stretched, and revenue is still flat. The diagnosis was wrong from the start.
The uncomfortable truth is that most growth stalls are internal, not external. The market did not change. The competition did not suddenly get better. The business hit a structural ceiling it built for itself, usually by scaling activity without scaling systems. I have watched companies with genuinely great products stay stuck at $5M for years because the founder could not let go of approval authority and had never written down how anything worked.
The other mistake I see constantly is treating a business operating system as a luxury for larger companies. It is not. The time to build documented processes and clear accountability is before you need them desperately, not after the growth stall has already cost you two years of momentum.
Disciplined diagnostics are not glamorous. They require sitting with uncomfortable data, interviewing customers who left, and admitting that the bottleneck is often the person in the mirror. But owners who do this work consistently are the ones who break through revenue ceilings instead of circling them.
— Andre
How Dynamicgrowthsolutions helps you break through growth barriers

Dynamicgrowthsolutions works with mid-market owners who are done guessing and ready to fix the actual problem. The AOS (Accelerated Operating System) is a proprietary business transformation framework built specifically for companies between $3M and $50M in revenue. It replaces founder dependency with documented systems, clear accountability, and measurable performance at every level. Dynamicgrowthsolutions also runs exclusive CEO retreats and mastermind events where mid-market leaders work through their specific growth constraints with peers and advisors who have solved the same problems. If your business has stopped growing and you want a structured path forward, this is where that work begins.
FAQ
What does it mean to diagnose why business stopped growing?
Growth diagnosis is the structured process of identifying the specific barriers preventing revenue or operational expansion. It combines quantitative metrics like CAC, churn rate, and NRR with qualitative feedback from customers and team members to find root causes rather than symptoms.
How do I know if my business has hit a growth ceiling?
The clearest signal is flat or declining revenue for two or more consecutive quarters combined with rising founder workload. When the owner is working more but the business is not growing, the company has almost certainly hit a structural ceiling.
What is the Revenue Bridge and why does it matter?
The Revenue Bridge breaks total revenue change into new customer revenue, existing customer revenue, and lost customer revenue. It shows exactly where growth is failing so you can fix the right problem instead of spending on the wrong solution.
Why do most mid-market businesses stall at the same revenue levels?
87% of companies hit a growth stall because they use the same operating model at higher revenue that worked at lower revenue. The transitions at $3M, $10M, and $30M each require a fundamentally different operating architecture to sustain growth.
How long does a proper growth diagnostic take?
A focused diagnostic covering financial metrics, operational data, and qualitative interviews typically takes four to six weeks. Structuring the follow-on fix as a 90-day sprint with weekly reviews produces measurable results within one quarter.